
VITA APP
RESPONSIBILITIES:
Primary Research Analysis, Task Flows, Information Architecture, High-Fidelity Wireframing, Interactive Prototyping, Micro-interactions Design.
TOOLS:
Adobe XD, Adobe After Effects, Miro, Google Drawings.
TEAM:
5 UX Designers, 3 Industrial Designers
Community Based Food System
Problem Space
Toronto receives a great amount of food from other regions and countries. The price of fresh produce is usually high and in times of uncertainty, it goes even higher.
At the same time, many people in the Great Toronto Area would like to grow their own veggies, but the lack of space and facilities results in a waiting list with estimated times of up to 2 years for joining a community garden.
Human-Centered Design Process
We conducted brainstorming sessions and primary research to later synthesize the information and identify themes that we later investigated in secondary research. This led us to explore the first ideas and draw the first sketches of a solution, which included a physical artifact and a digital mobile application. The first Low-Fidelity wireframes were tested as paper prototypes, and after getting feedback and iterating the process, the High-Fidelity wireframes turned into an interactive digital prototype and final design.
Inspiration
The IDEO Method Cards were the perfect tool to begin the design process, using two decks for brainstorming (Technology Building Blocks and Product Development) to get ideas flowing and picture a broader scenario with all the factors related to our problem space.
Storyboard
We focused on the experience of a person that is trying to produce food at home to reduce costs but has not been successful.
Primary Research
We conducted interviews with citizens of Toronto that were in charge of buying groceries for their households. After analyzing the information, I realized that they had some personal characteristics in common, like being new Canadians and gardening enthusiasts and shared some pains and gains that are described in the following Empathy Map and User Persona.
Secondary Research
We analyzed the current scenario of the community gardens in the Toronto area, as well as some architectural projects that include rooftop farming and its impact on the community.
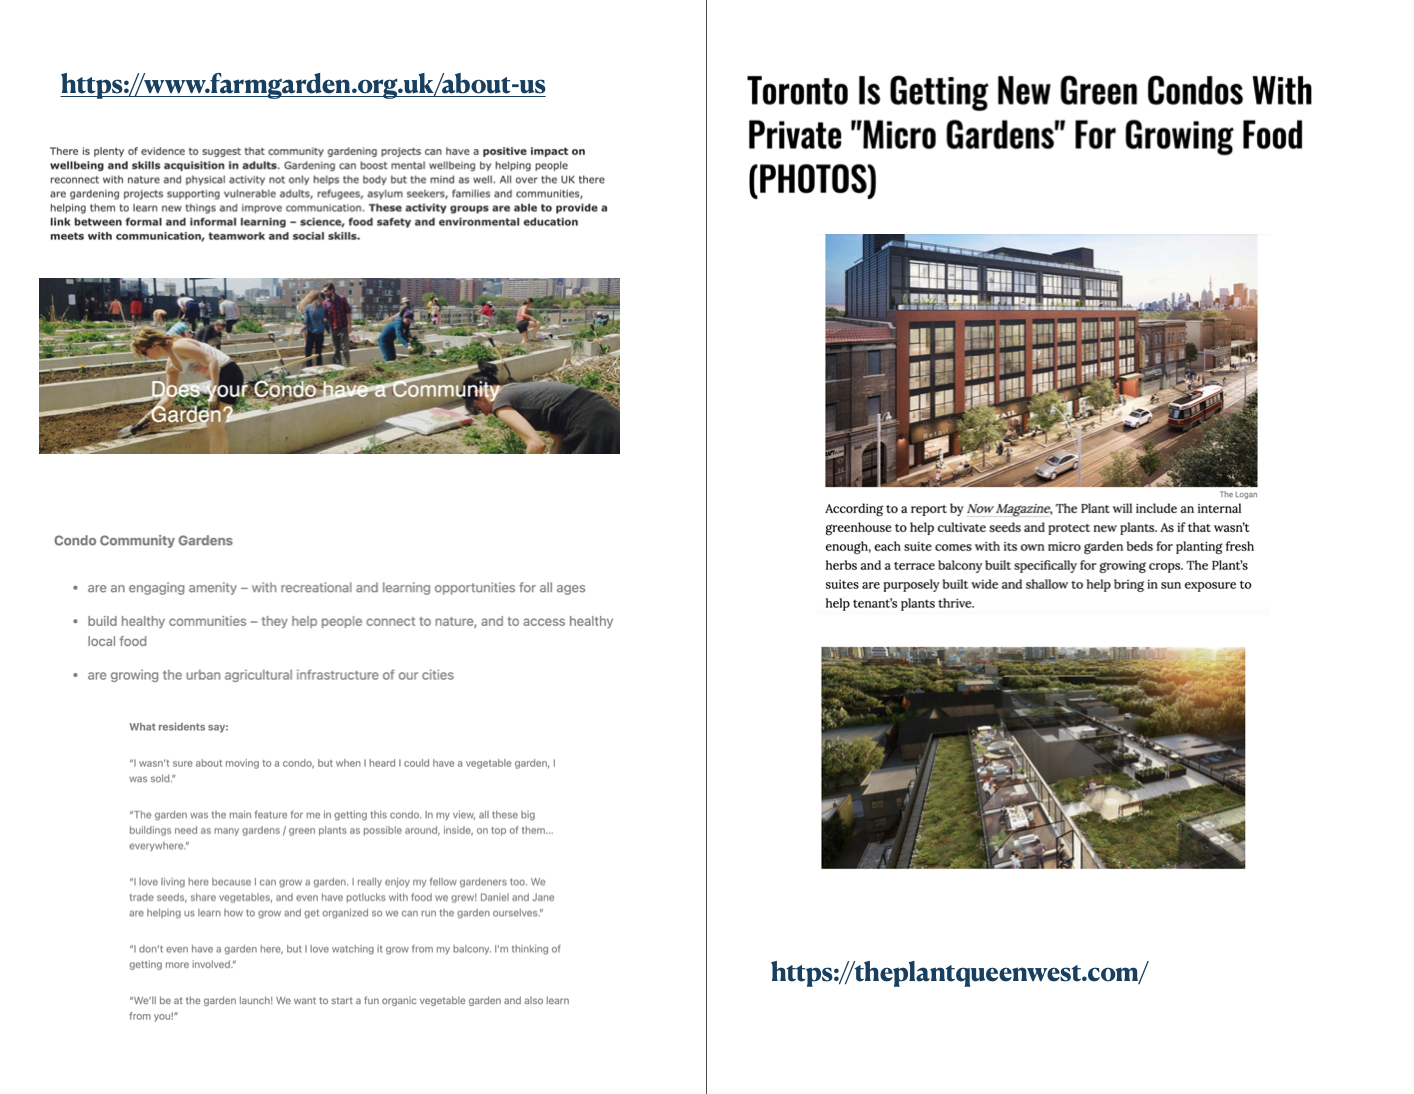


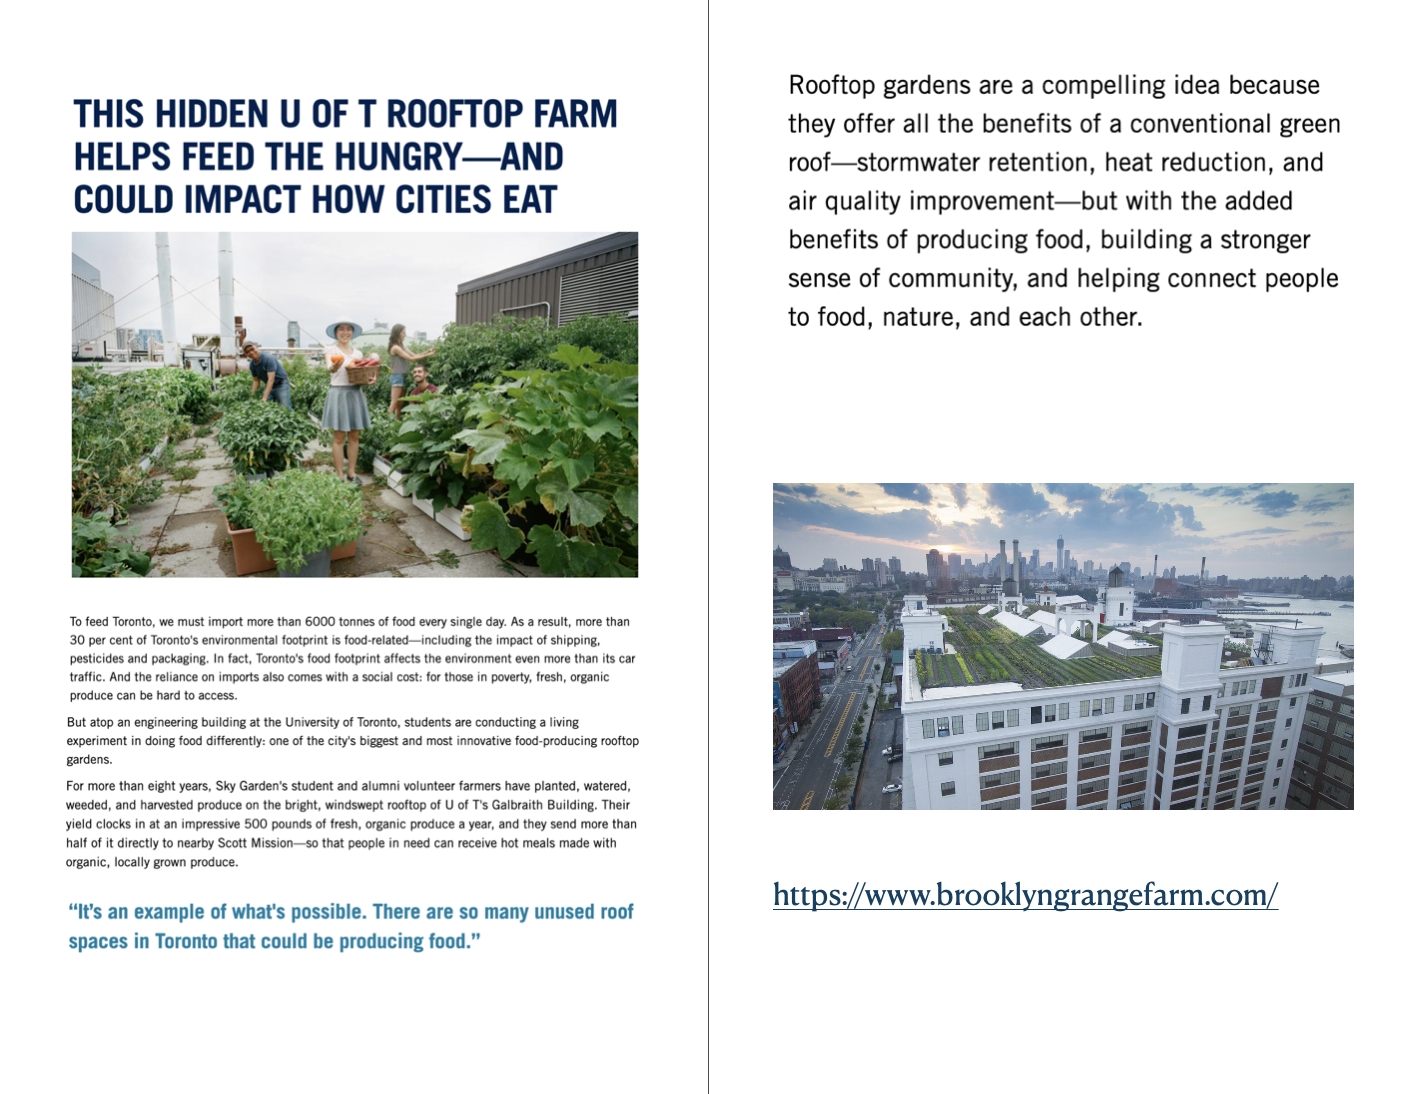


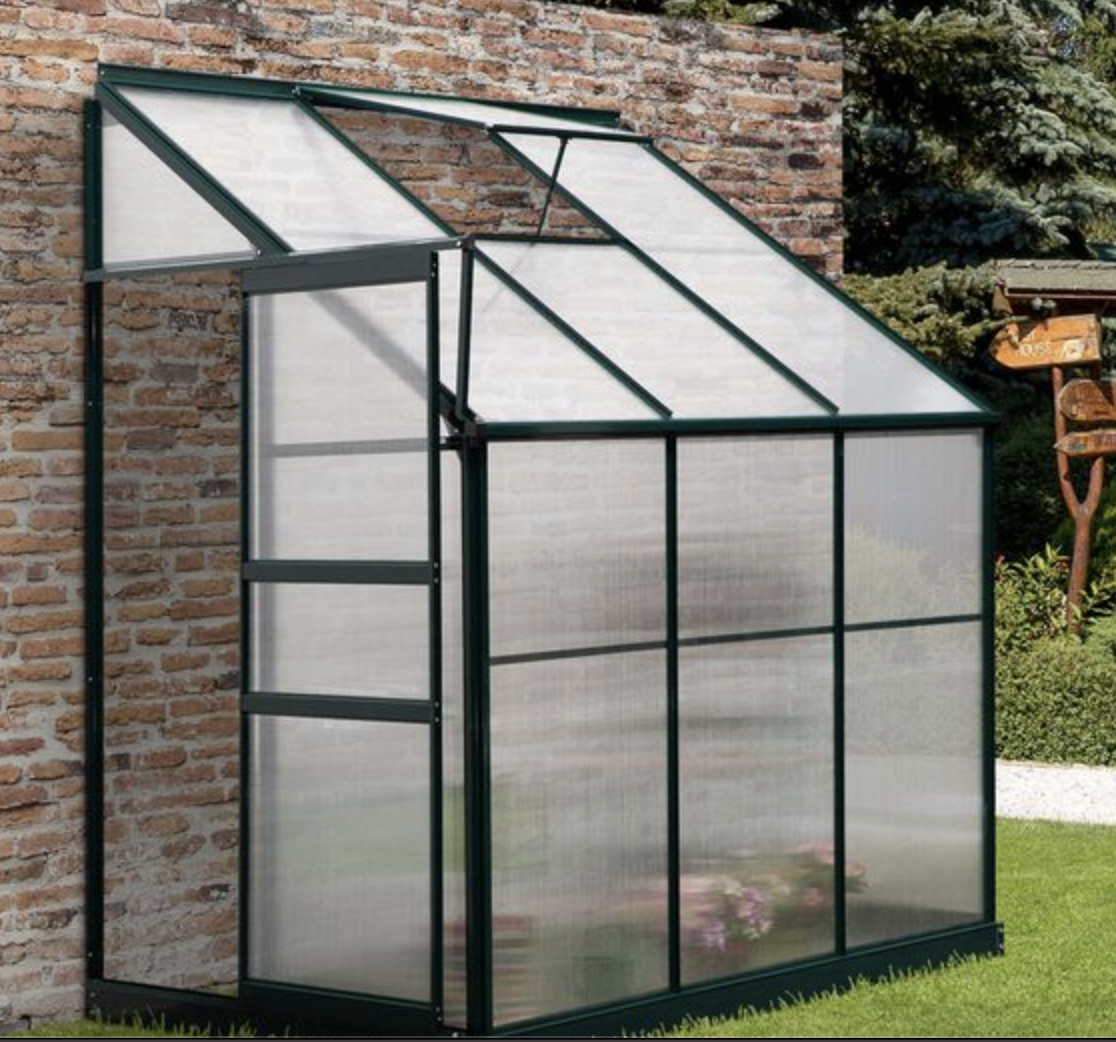
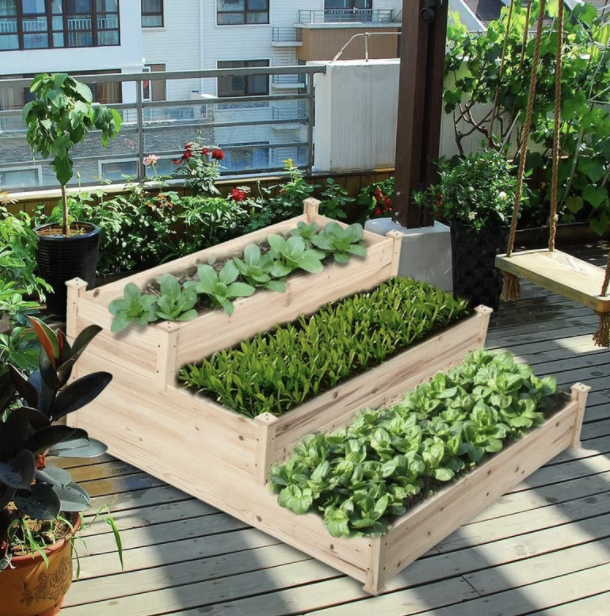
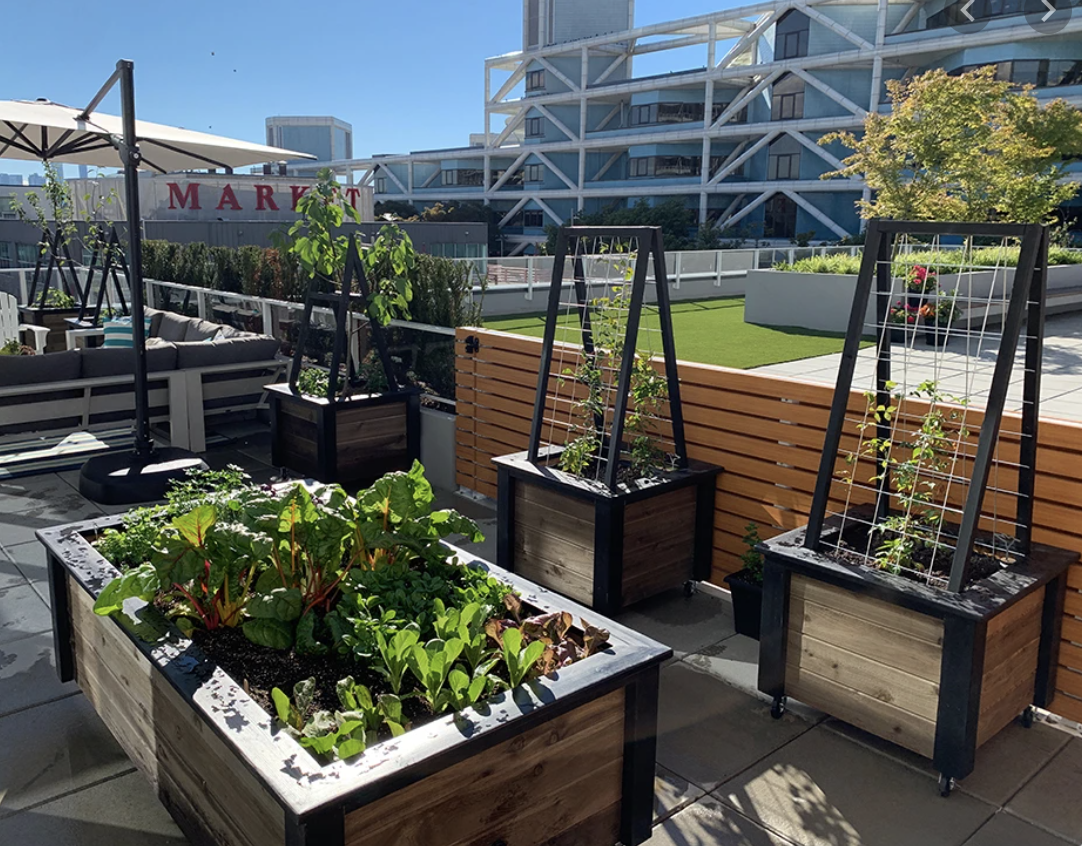

How might we empower people to grow their own produce?
Journey Mapping
The journey map shows the experience we are aiming to work with. It helps us understand why the pain points feel so bad and what are the steps to feeling better.
Concept Mapping
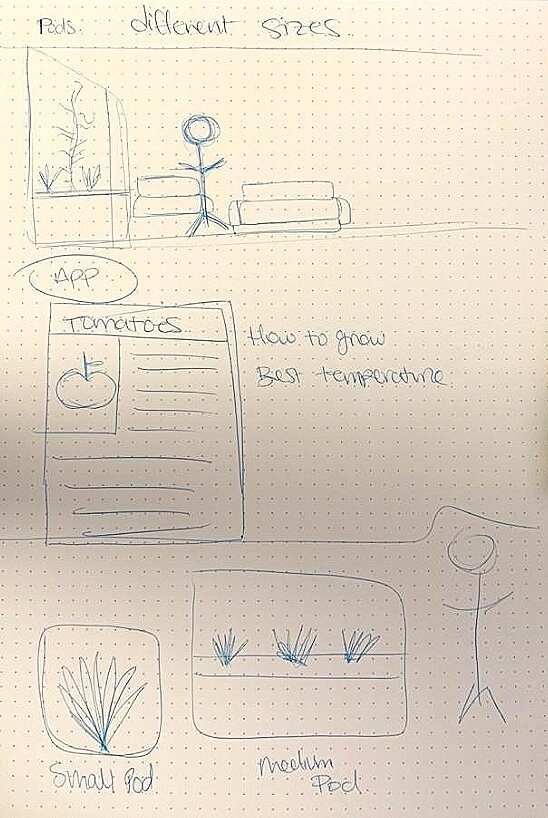
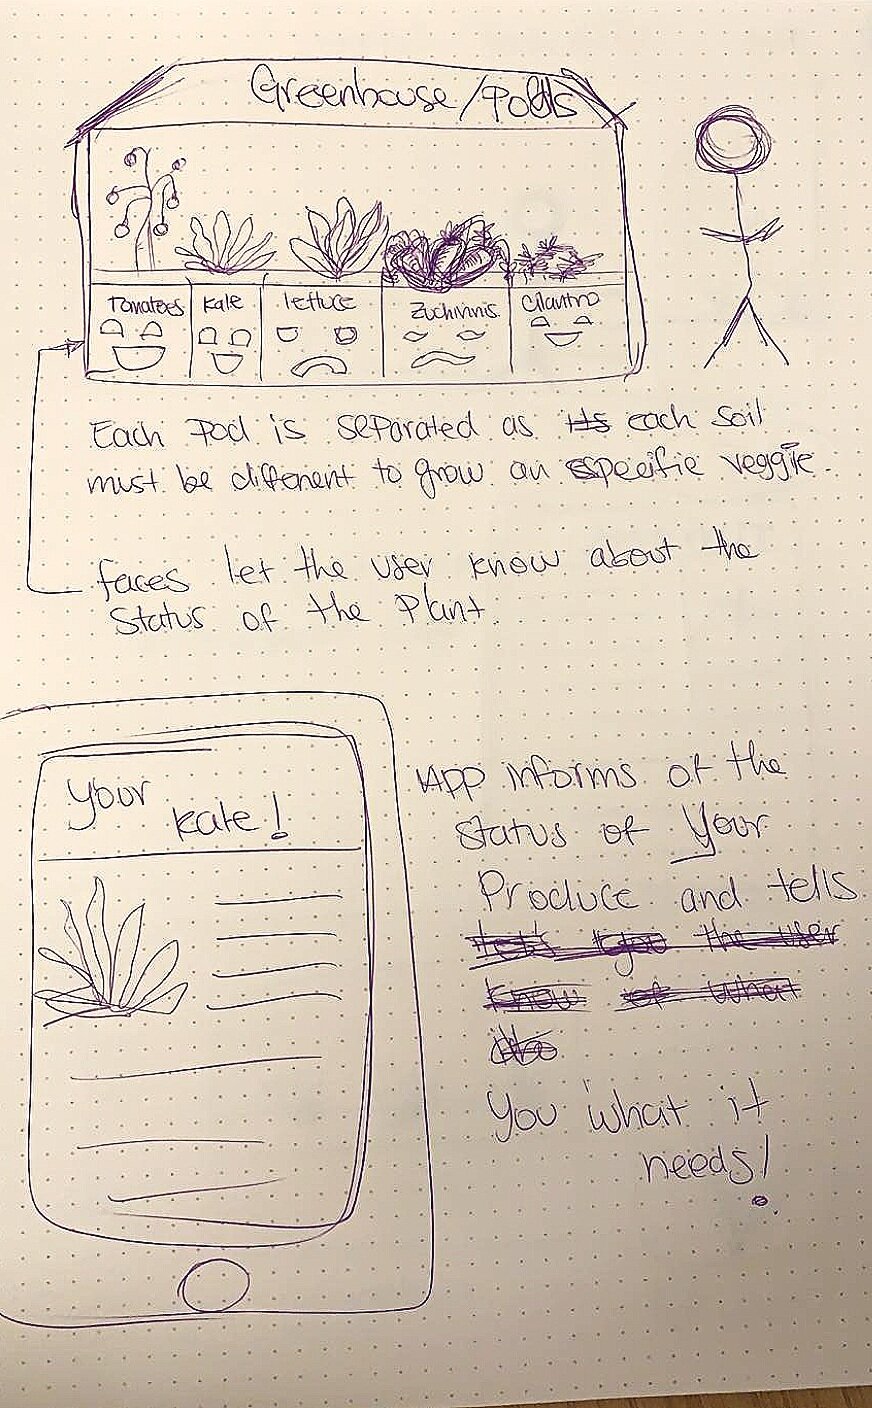
Sketches and Early Renders
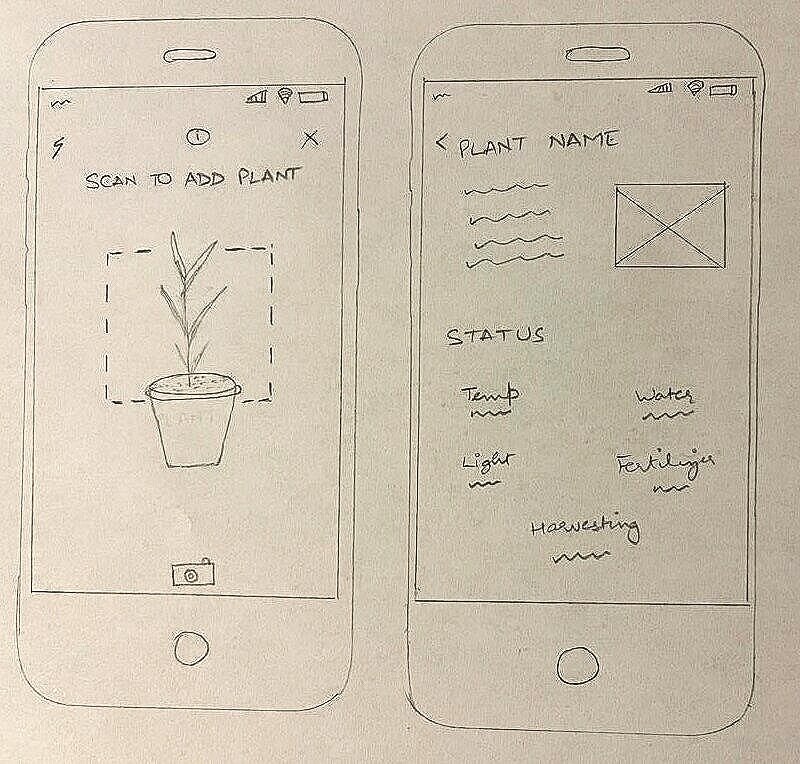
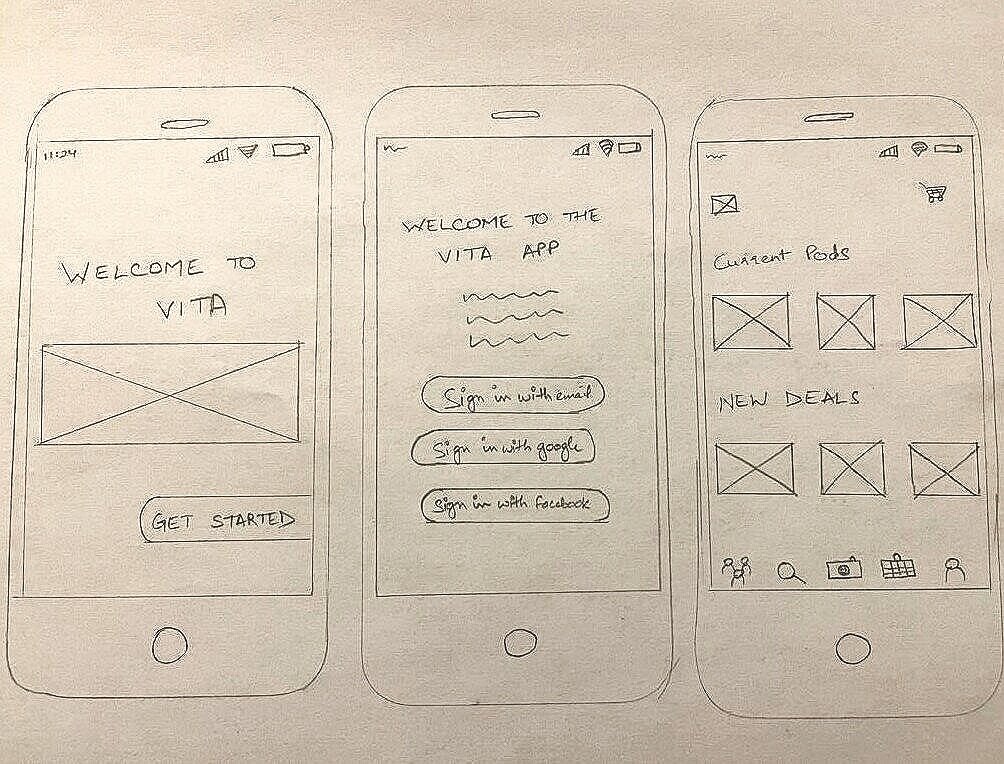


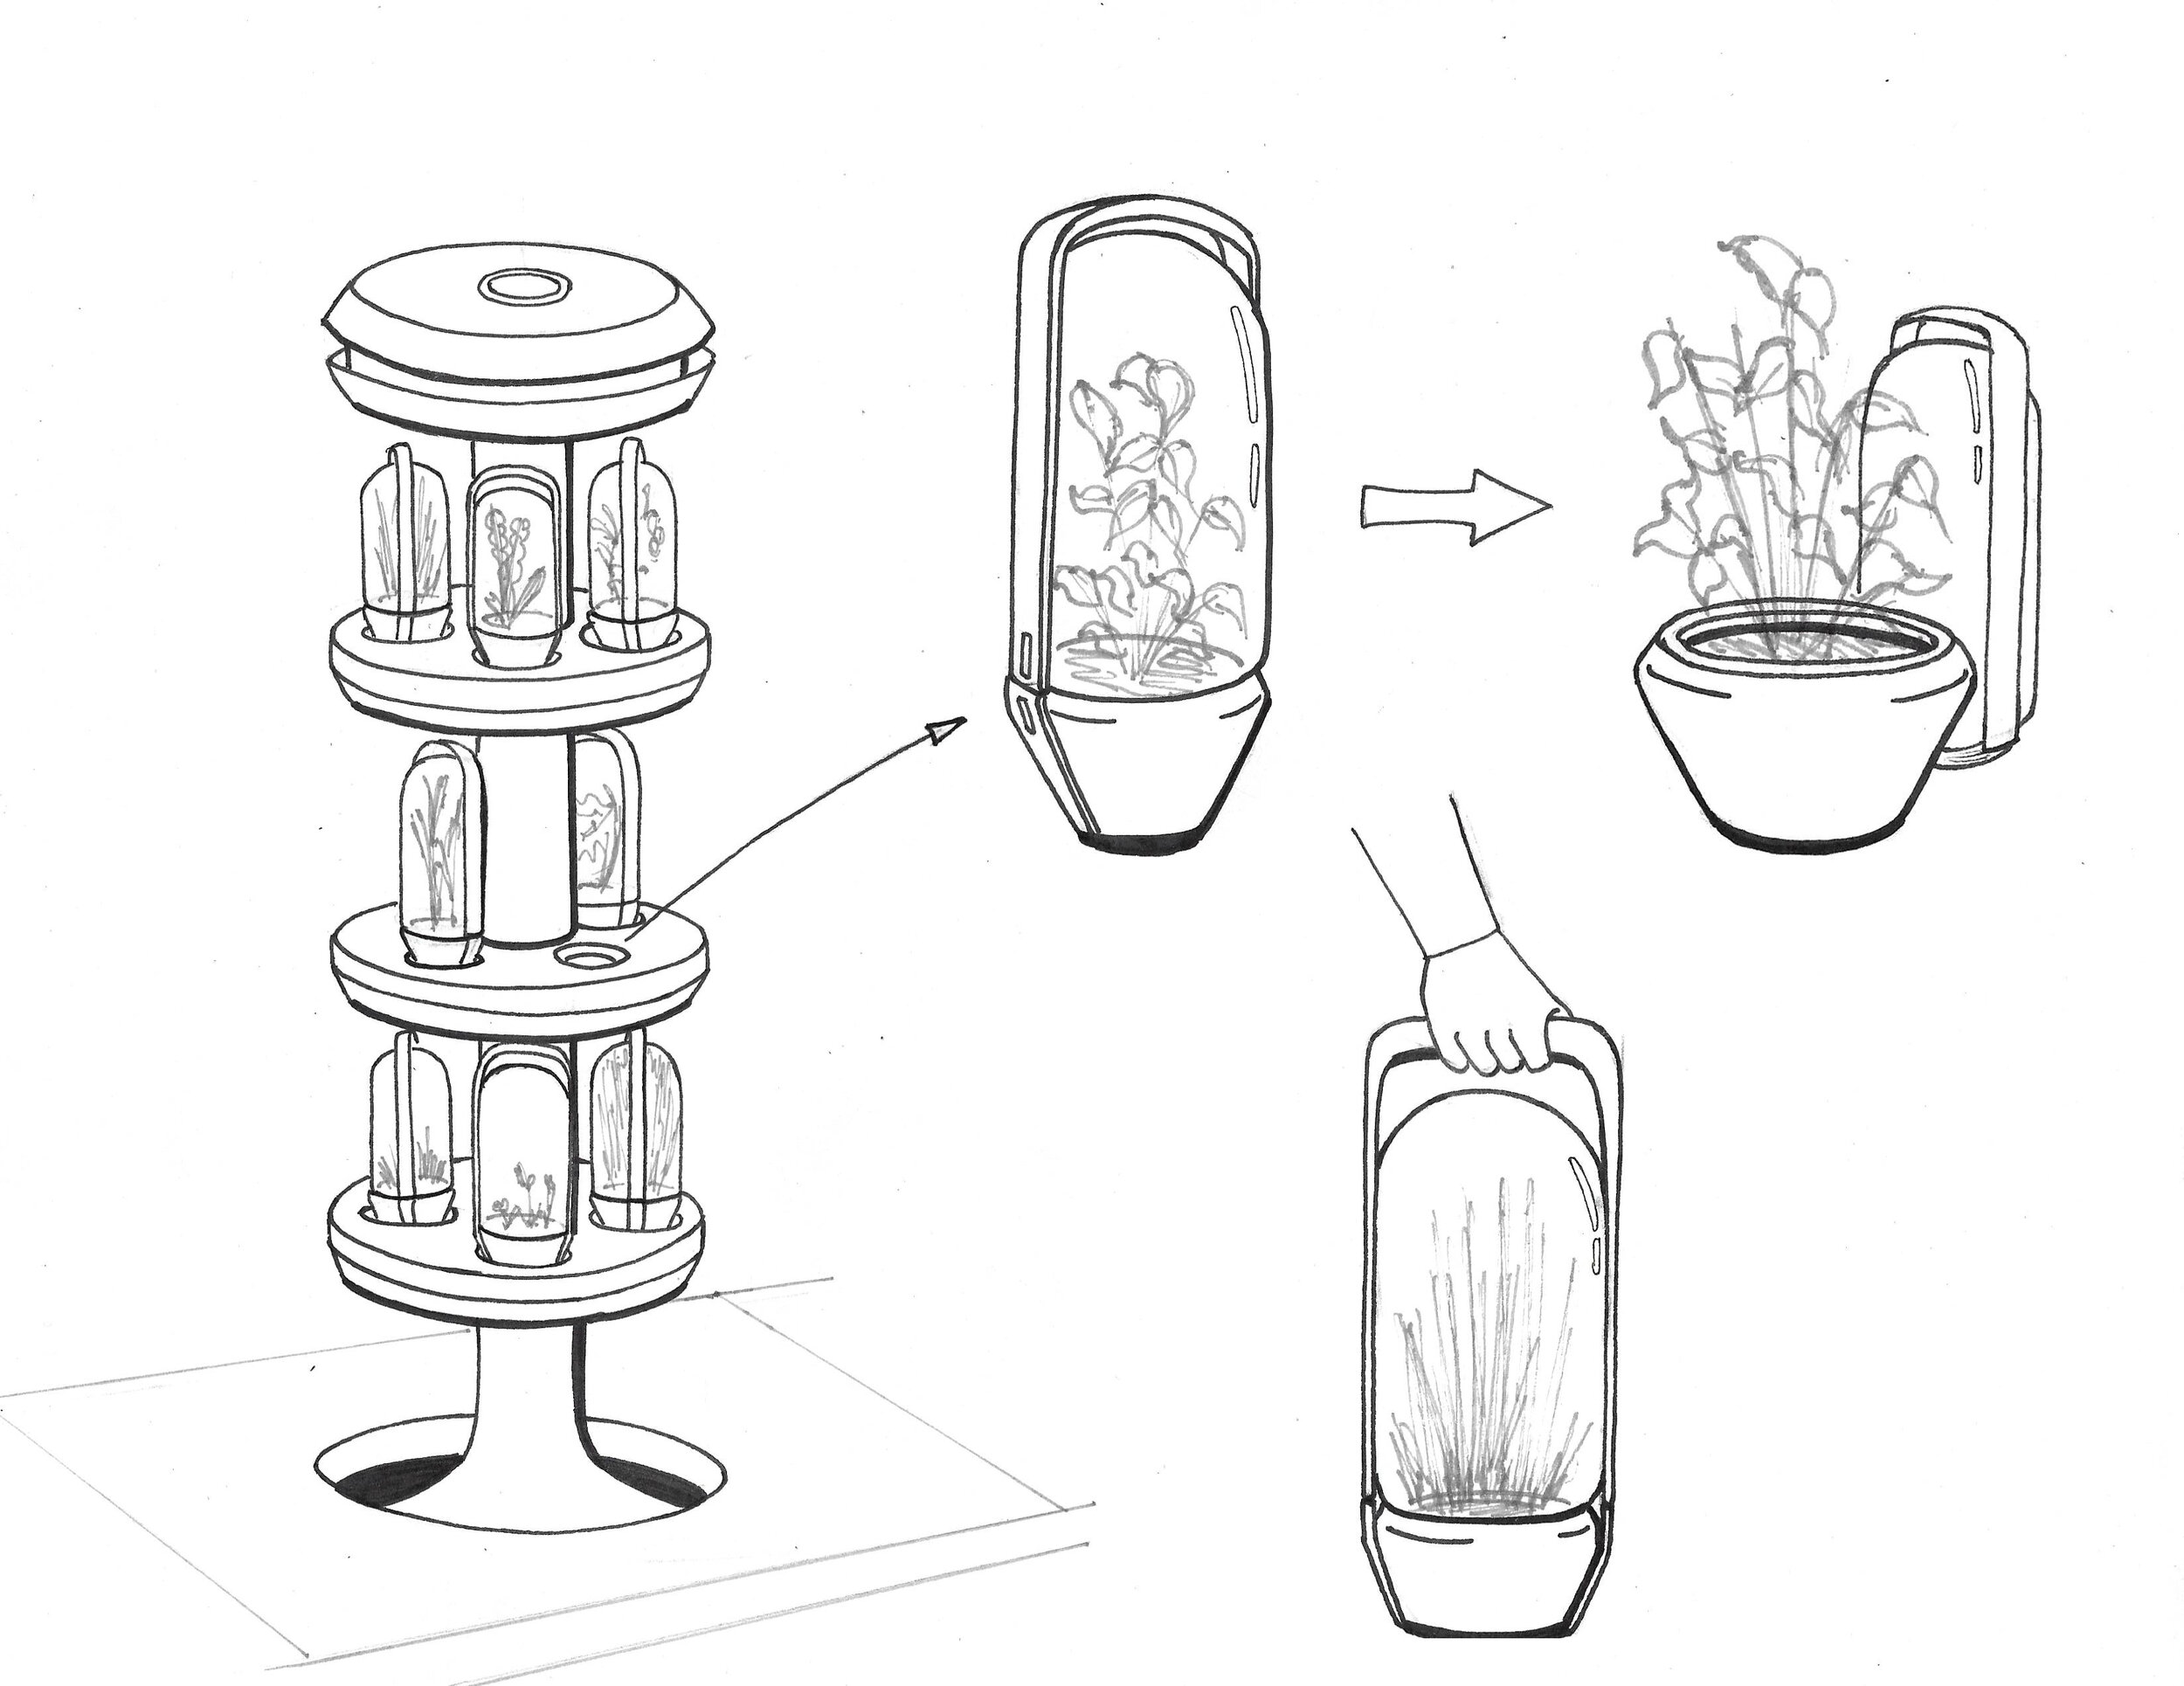
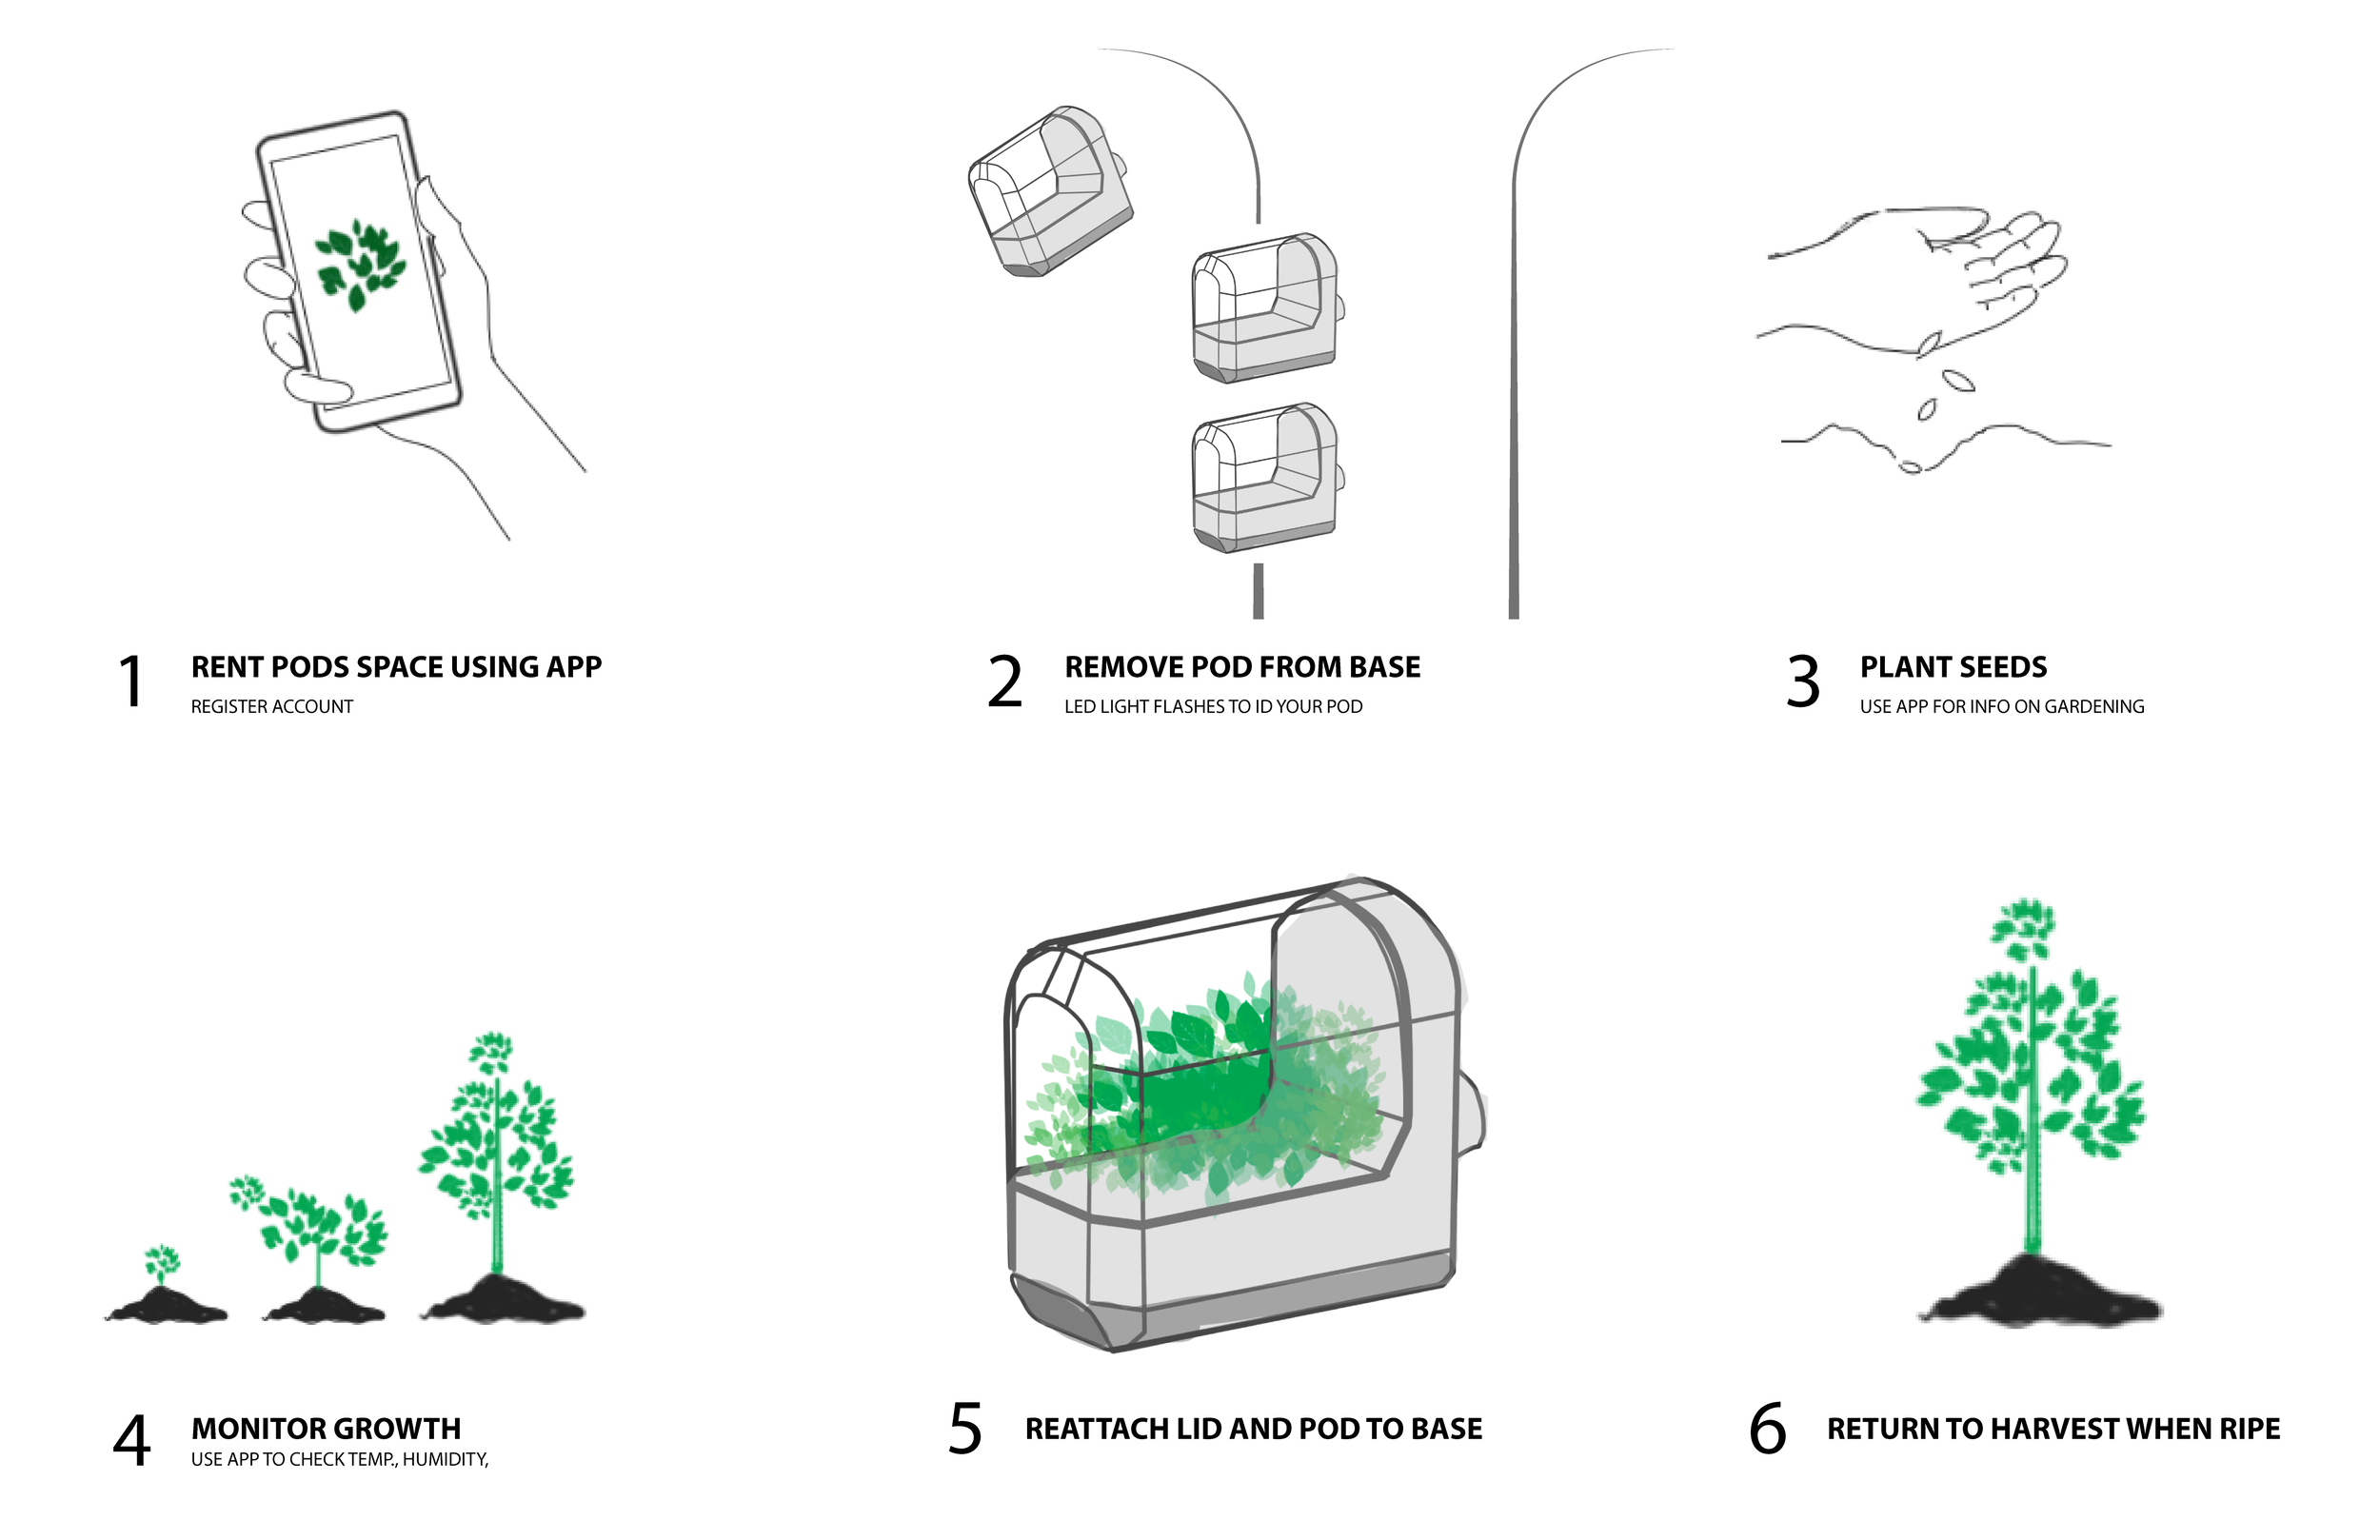


Low-Fidelity Wireframe
Based on the first interaction flow.
User Flow Diagram
After testing and refining the elements of the first wireframe, I proposed this simple yet complete user flow. It includes the most relevant sections available right from the home page, such as My Pods, Marketplace, Social, Messages, Calendar, and Settings.
High-Fidelity Wireframes

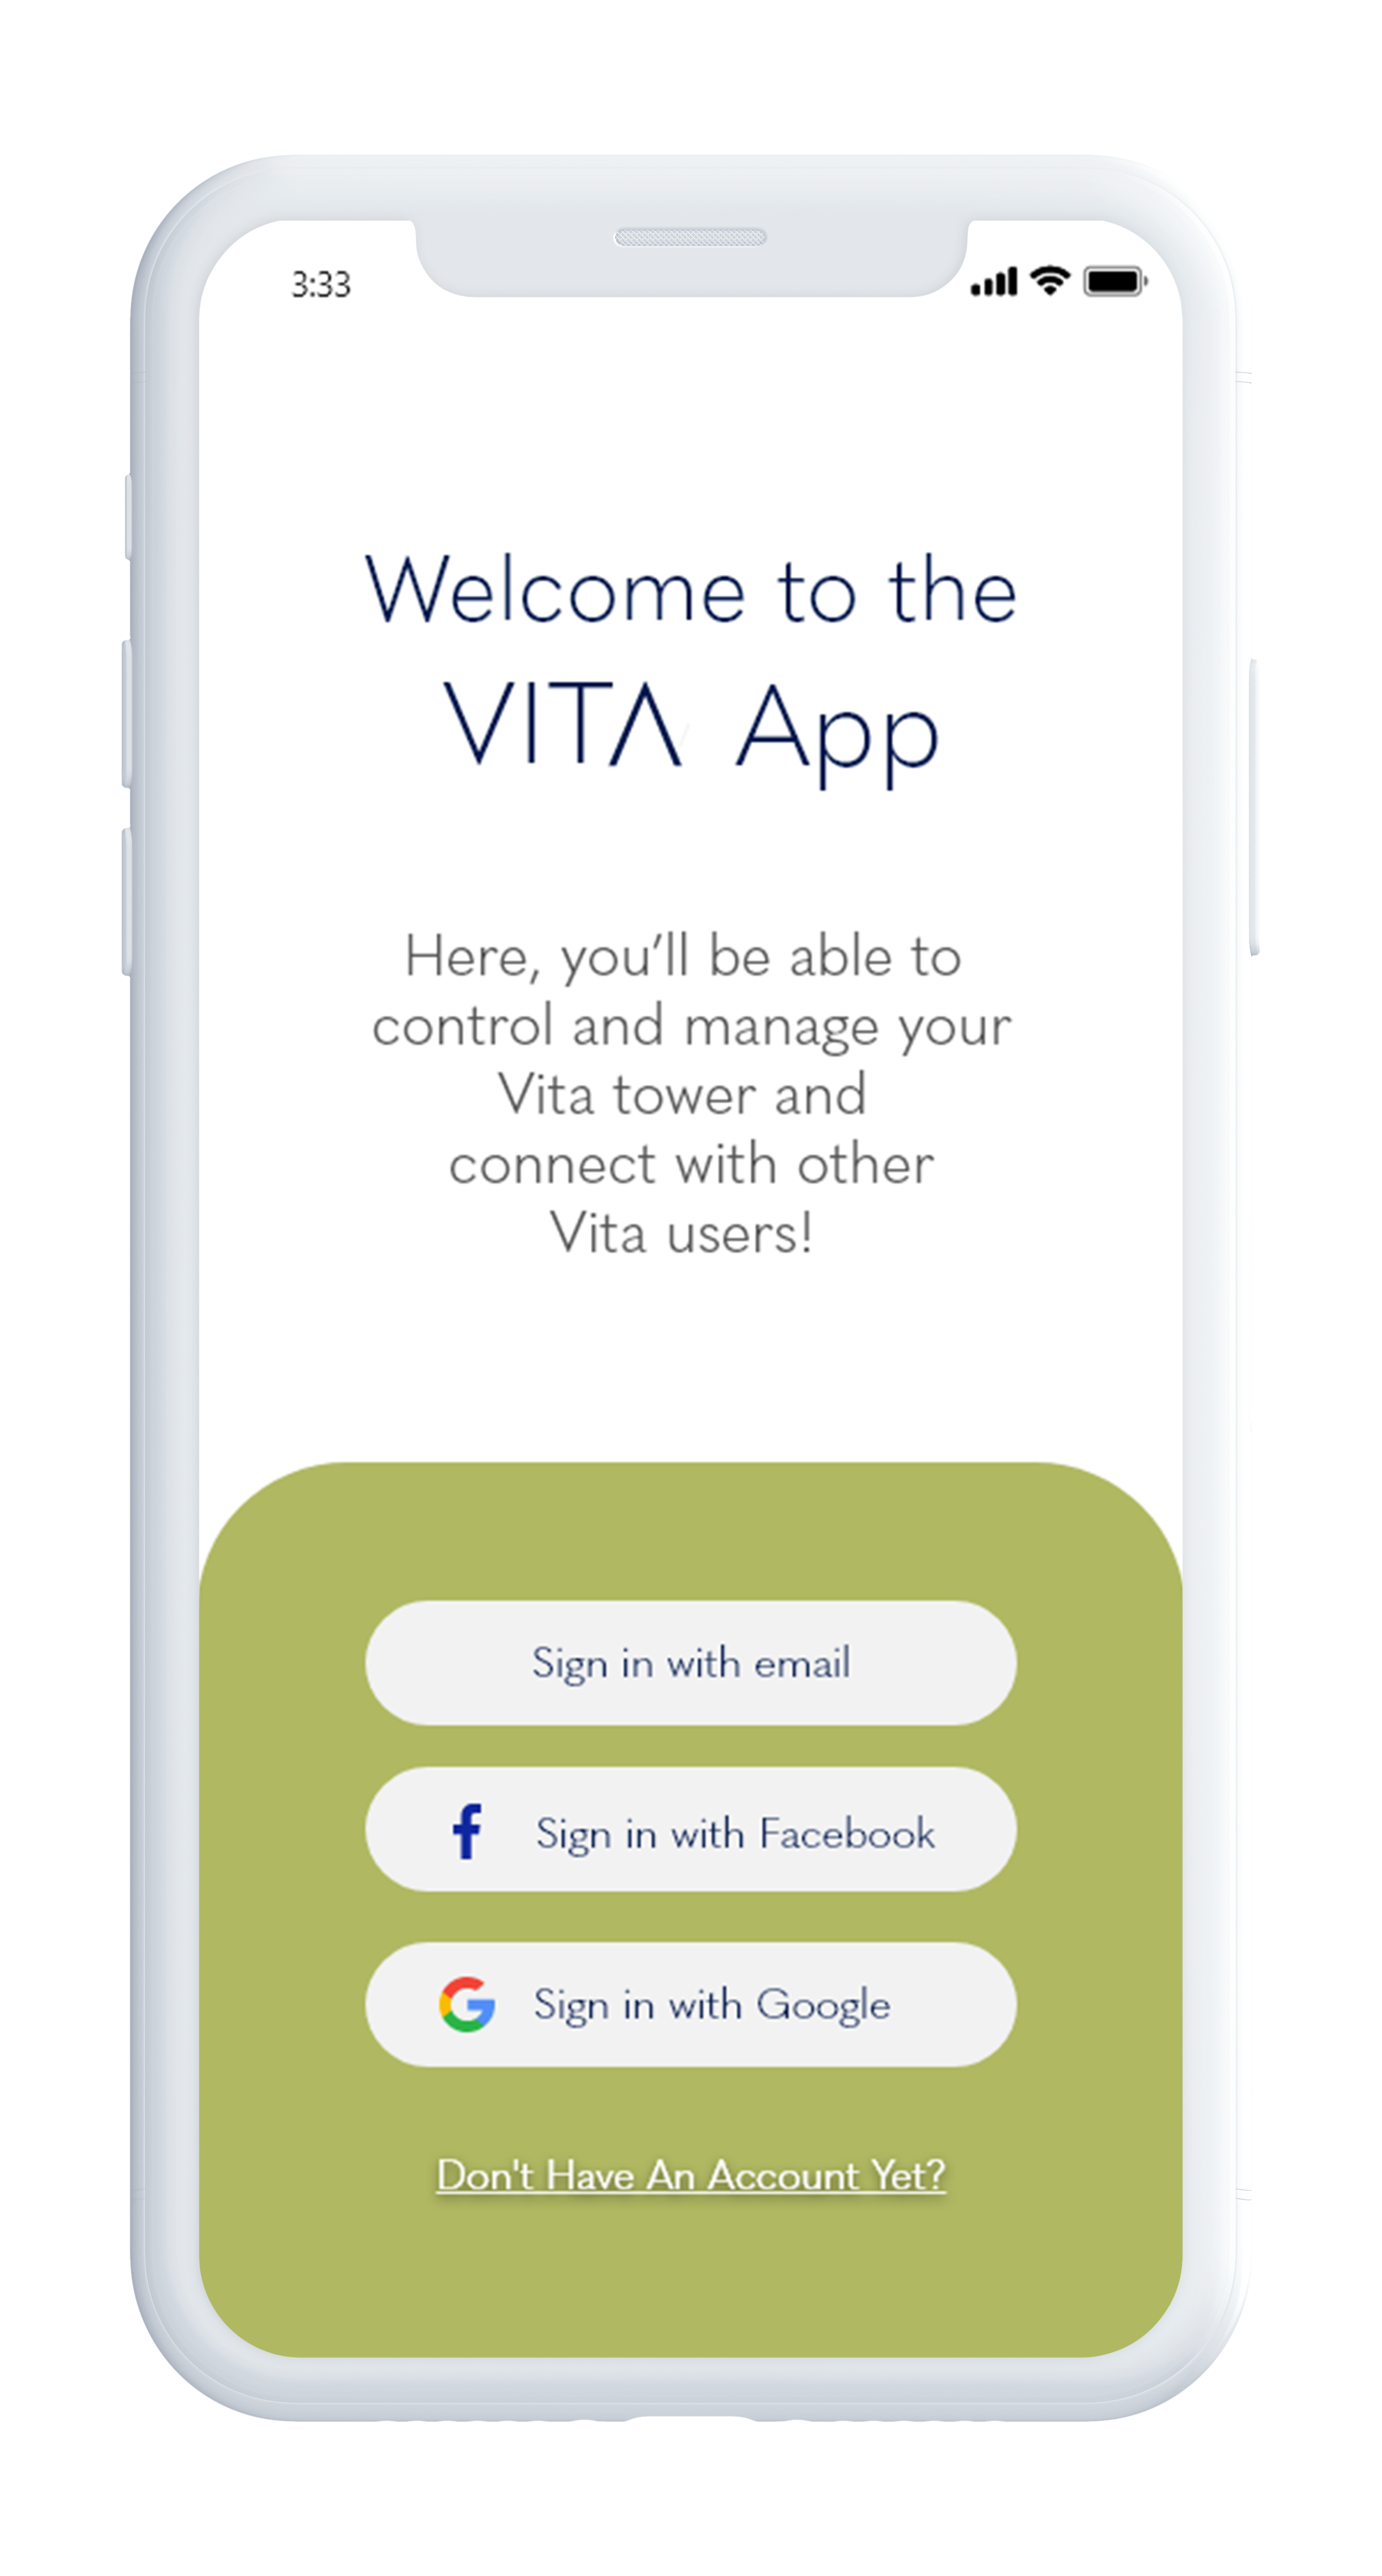

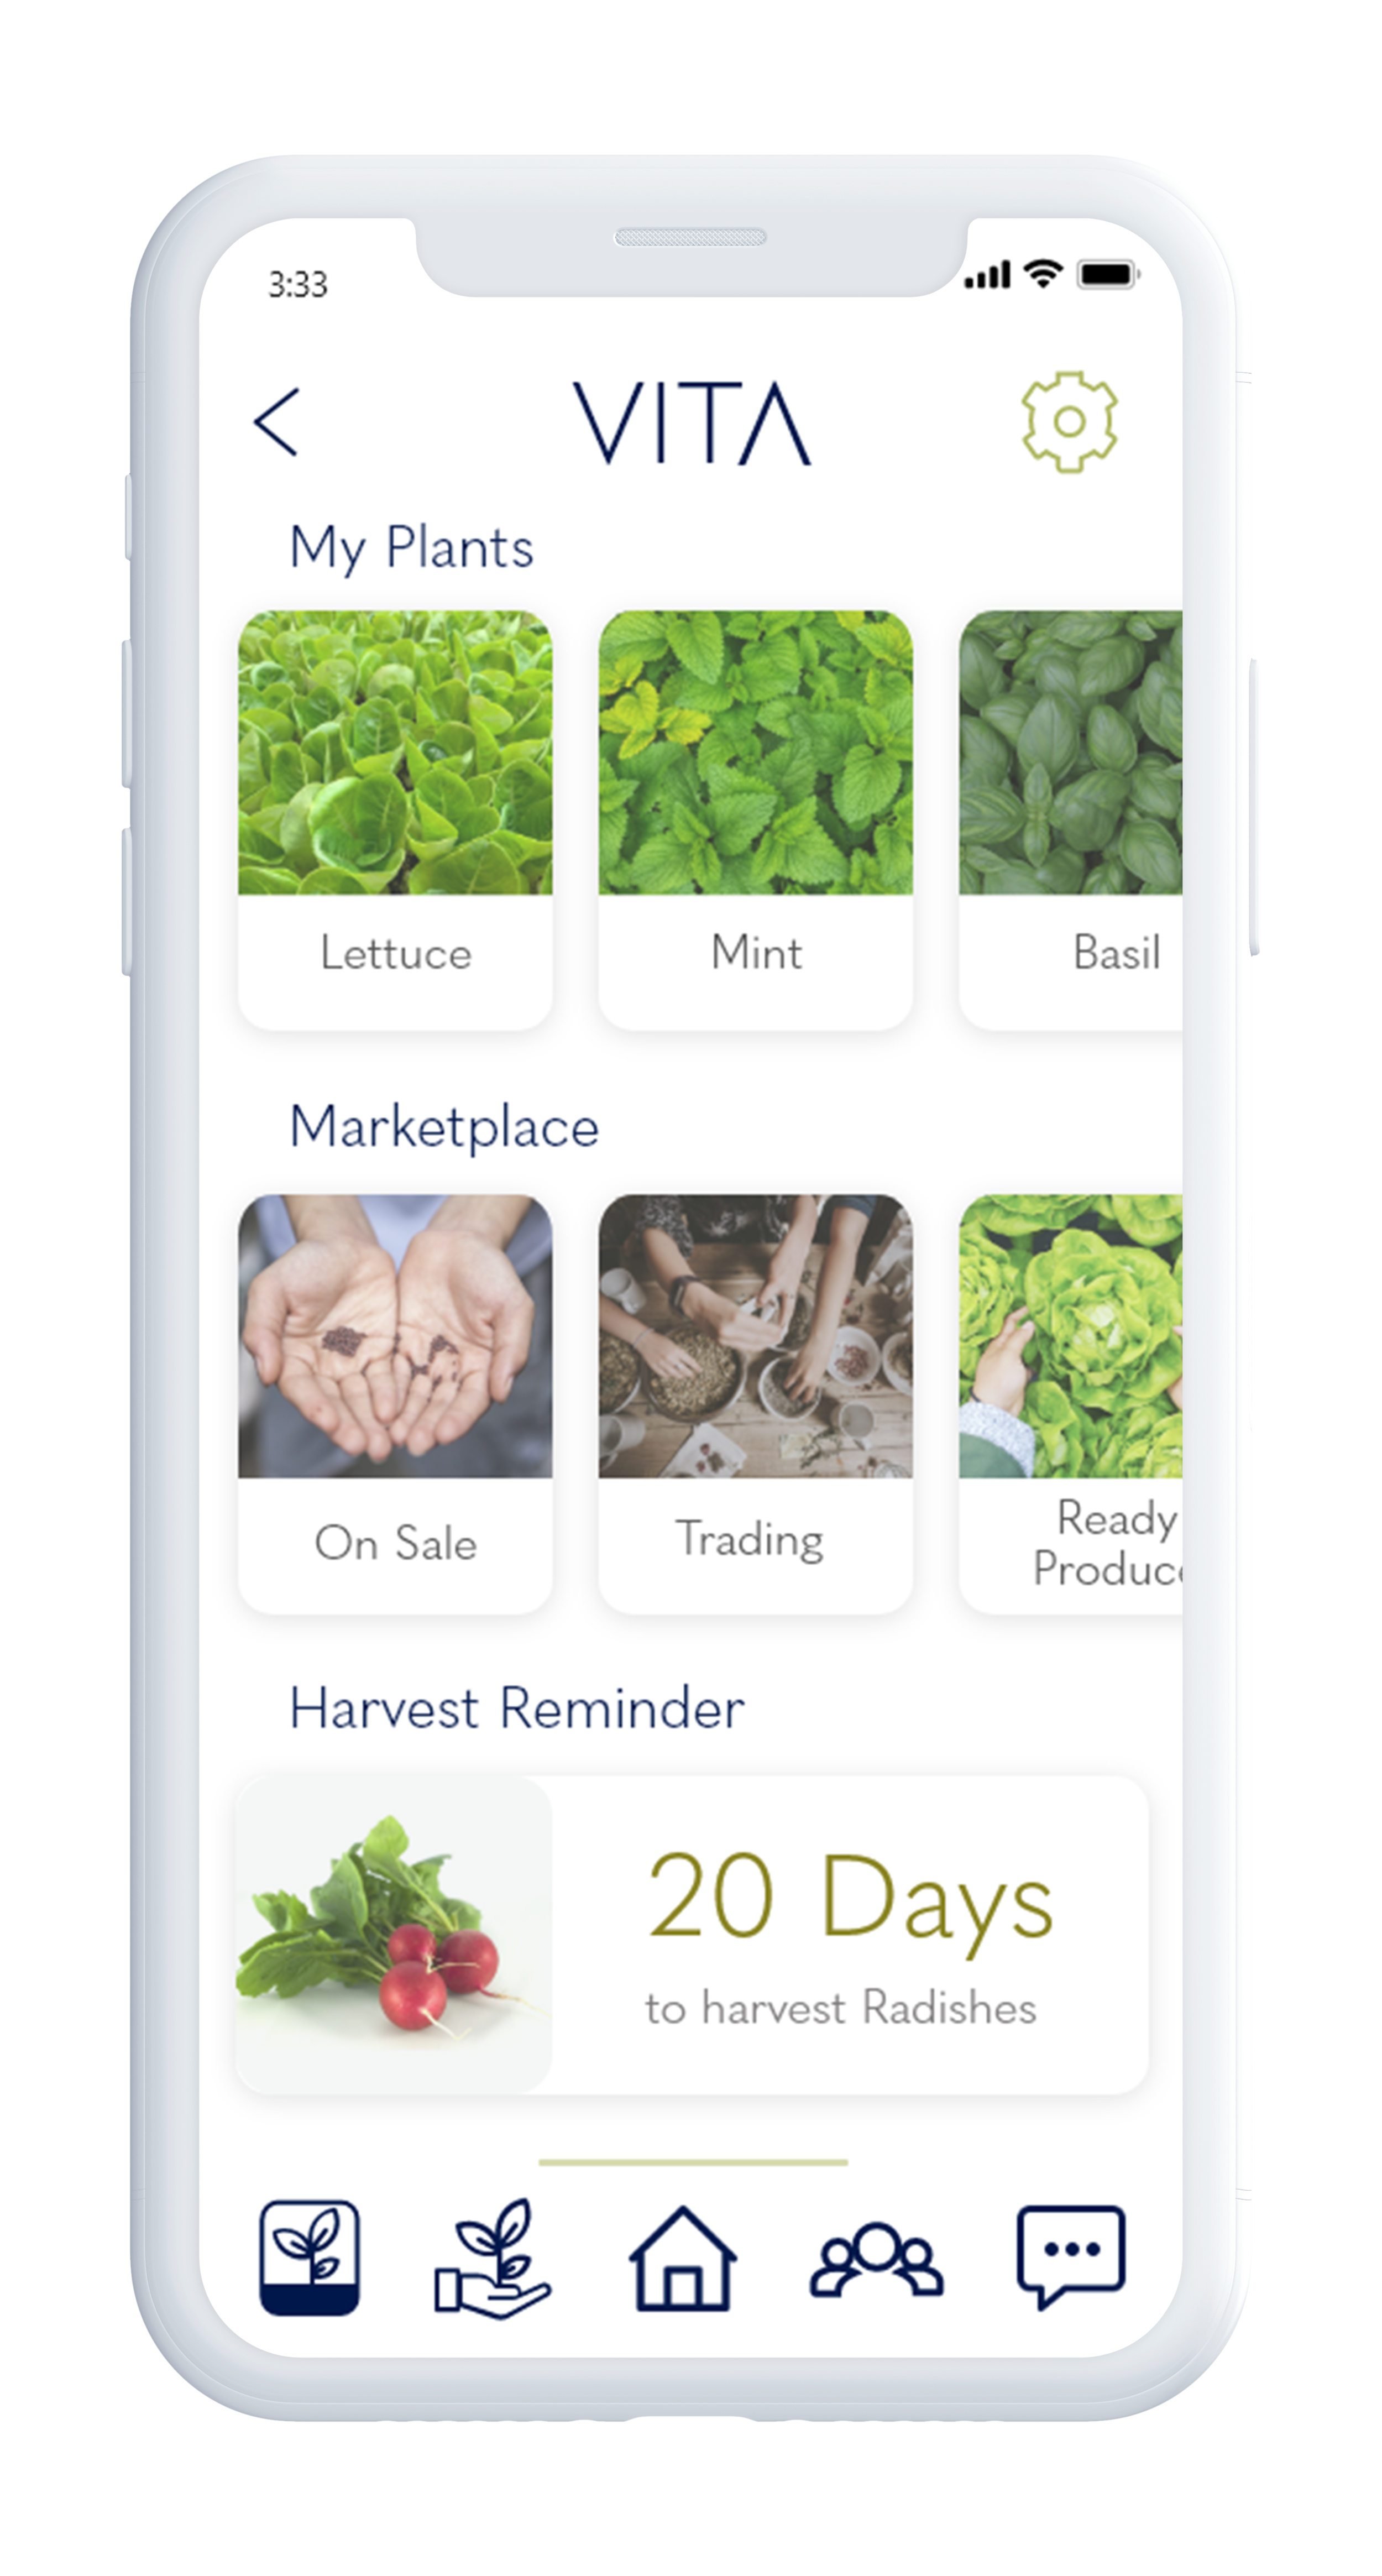


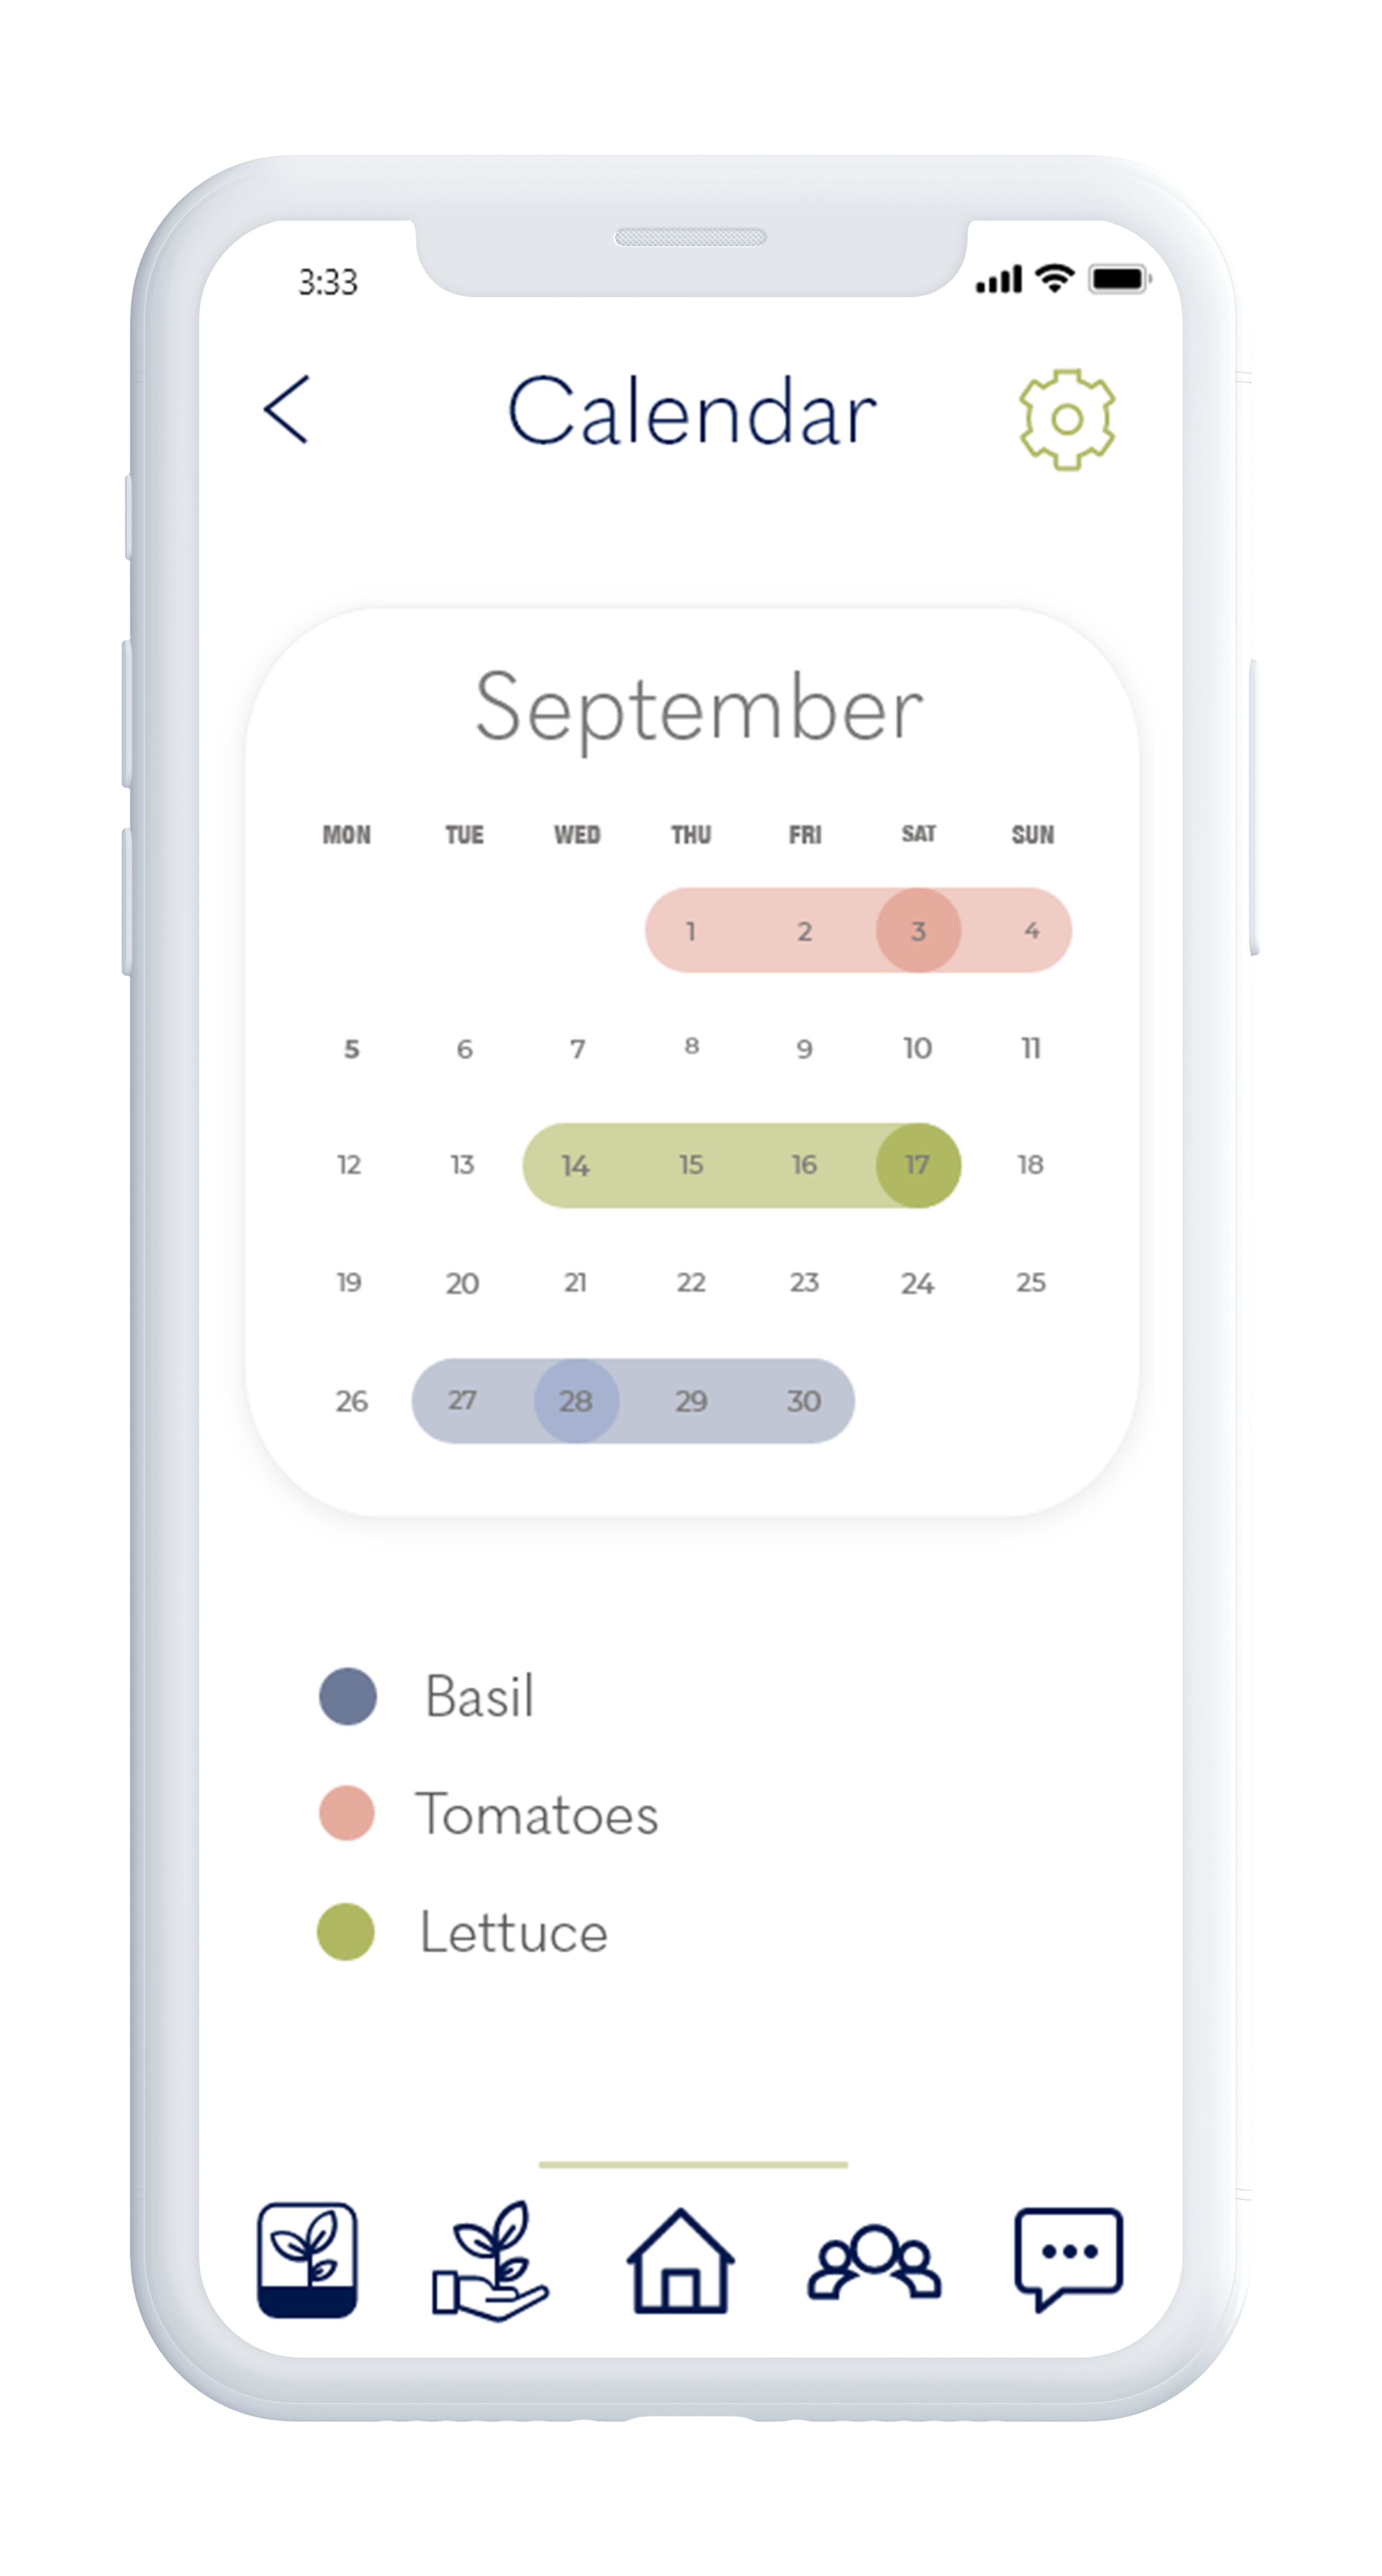

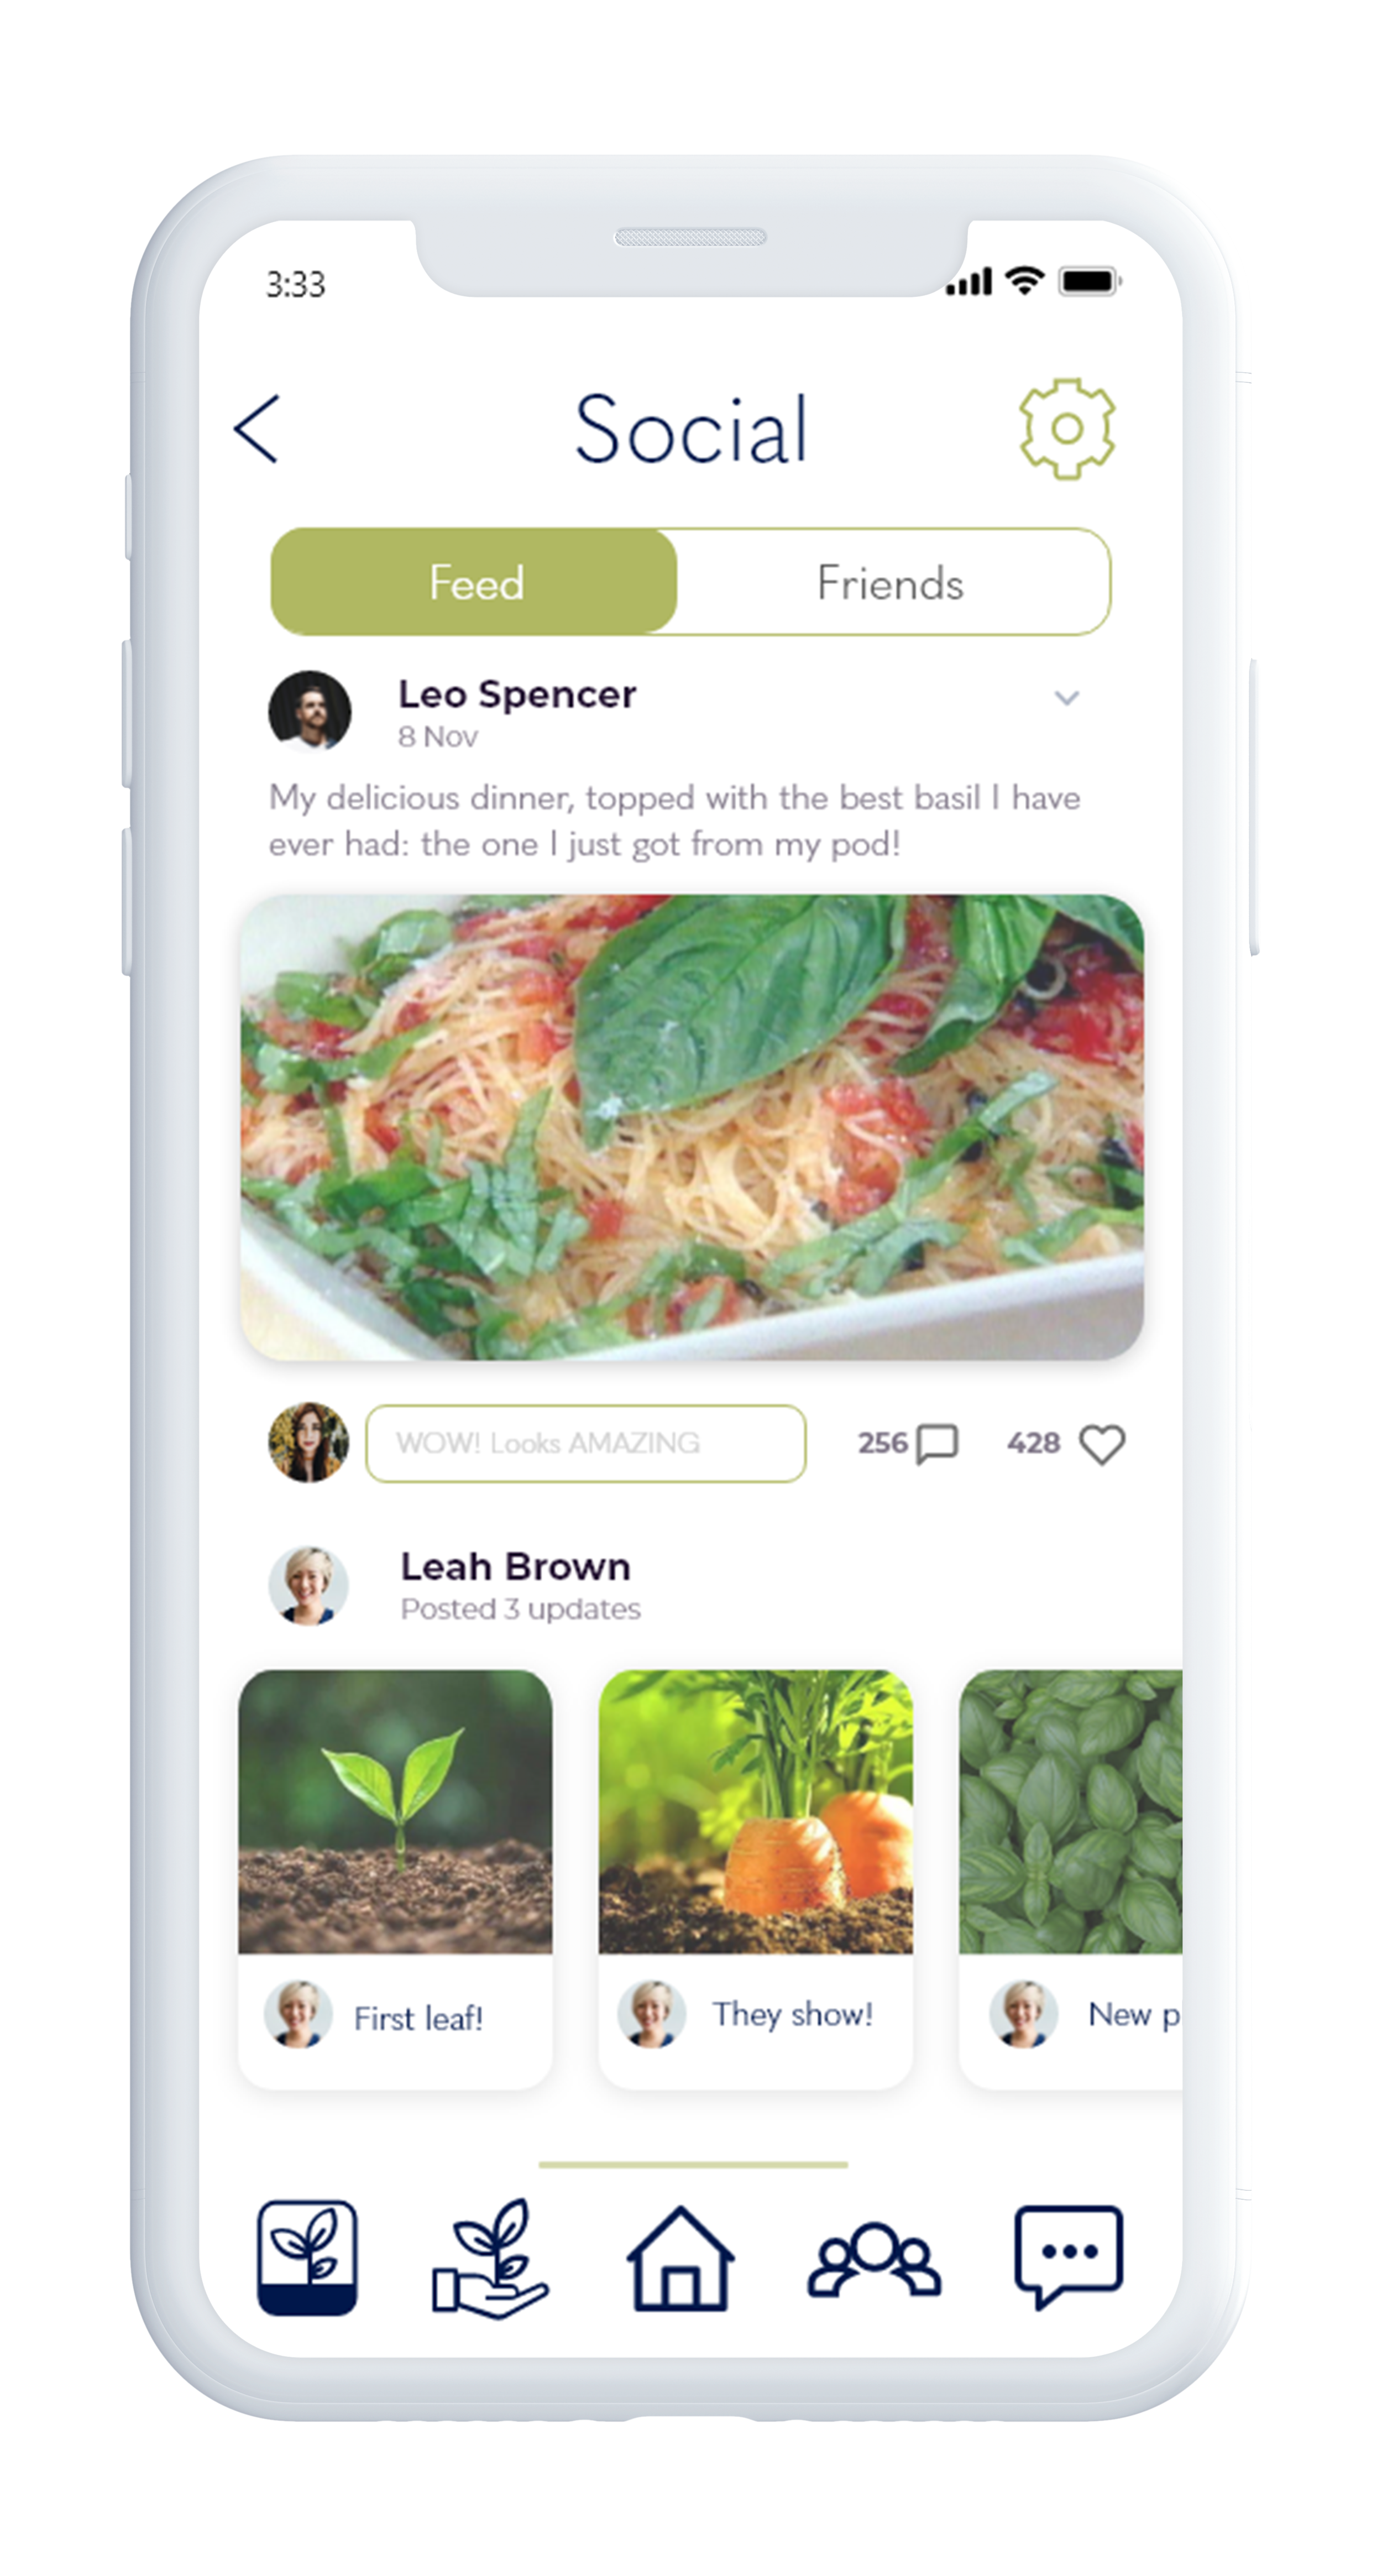
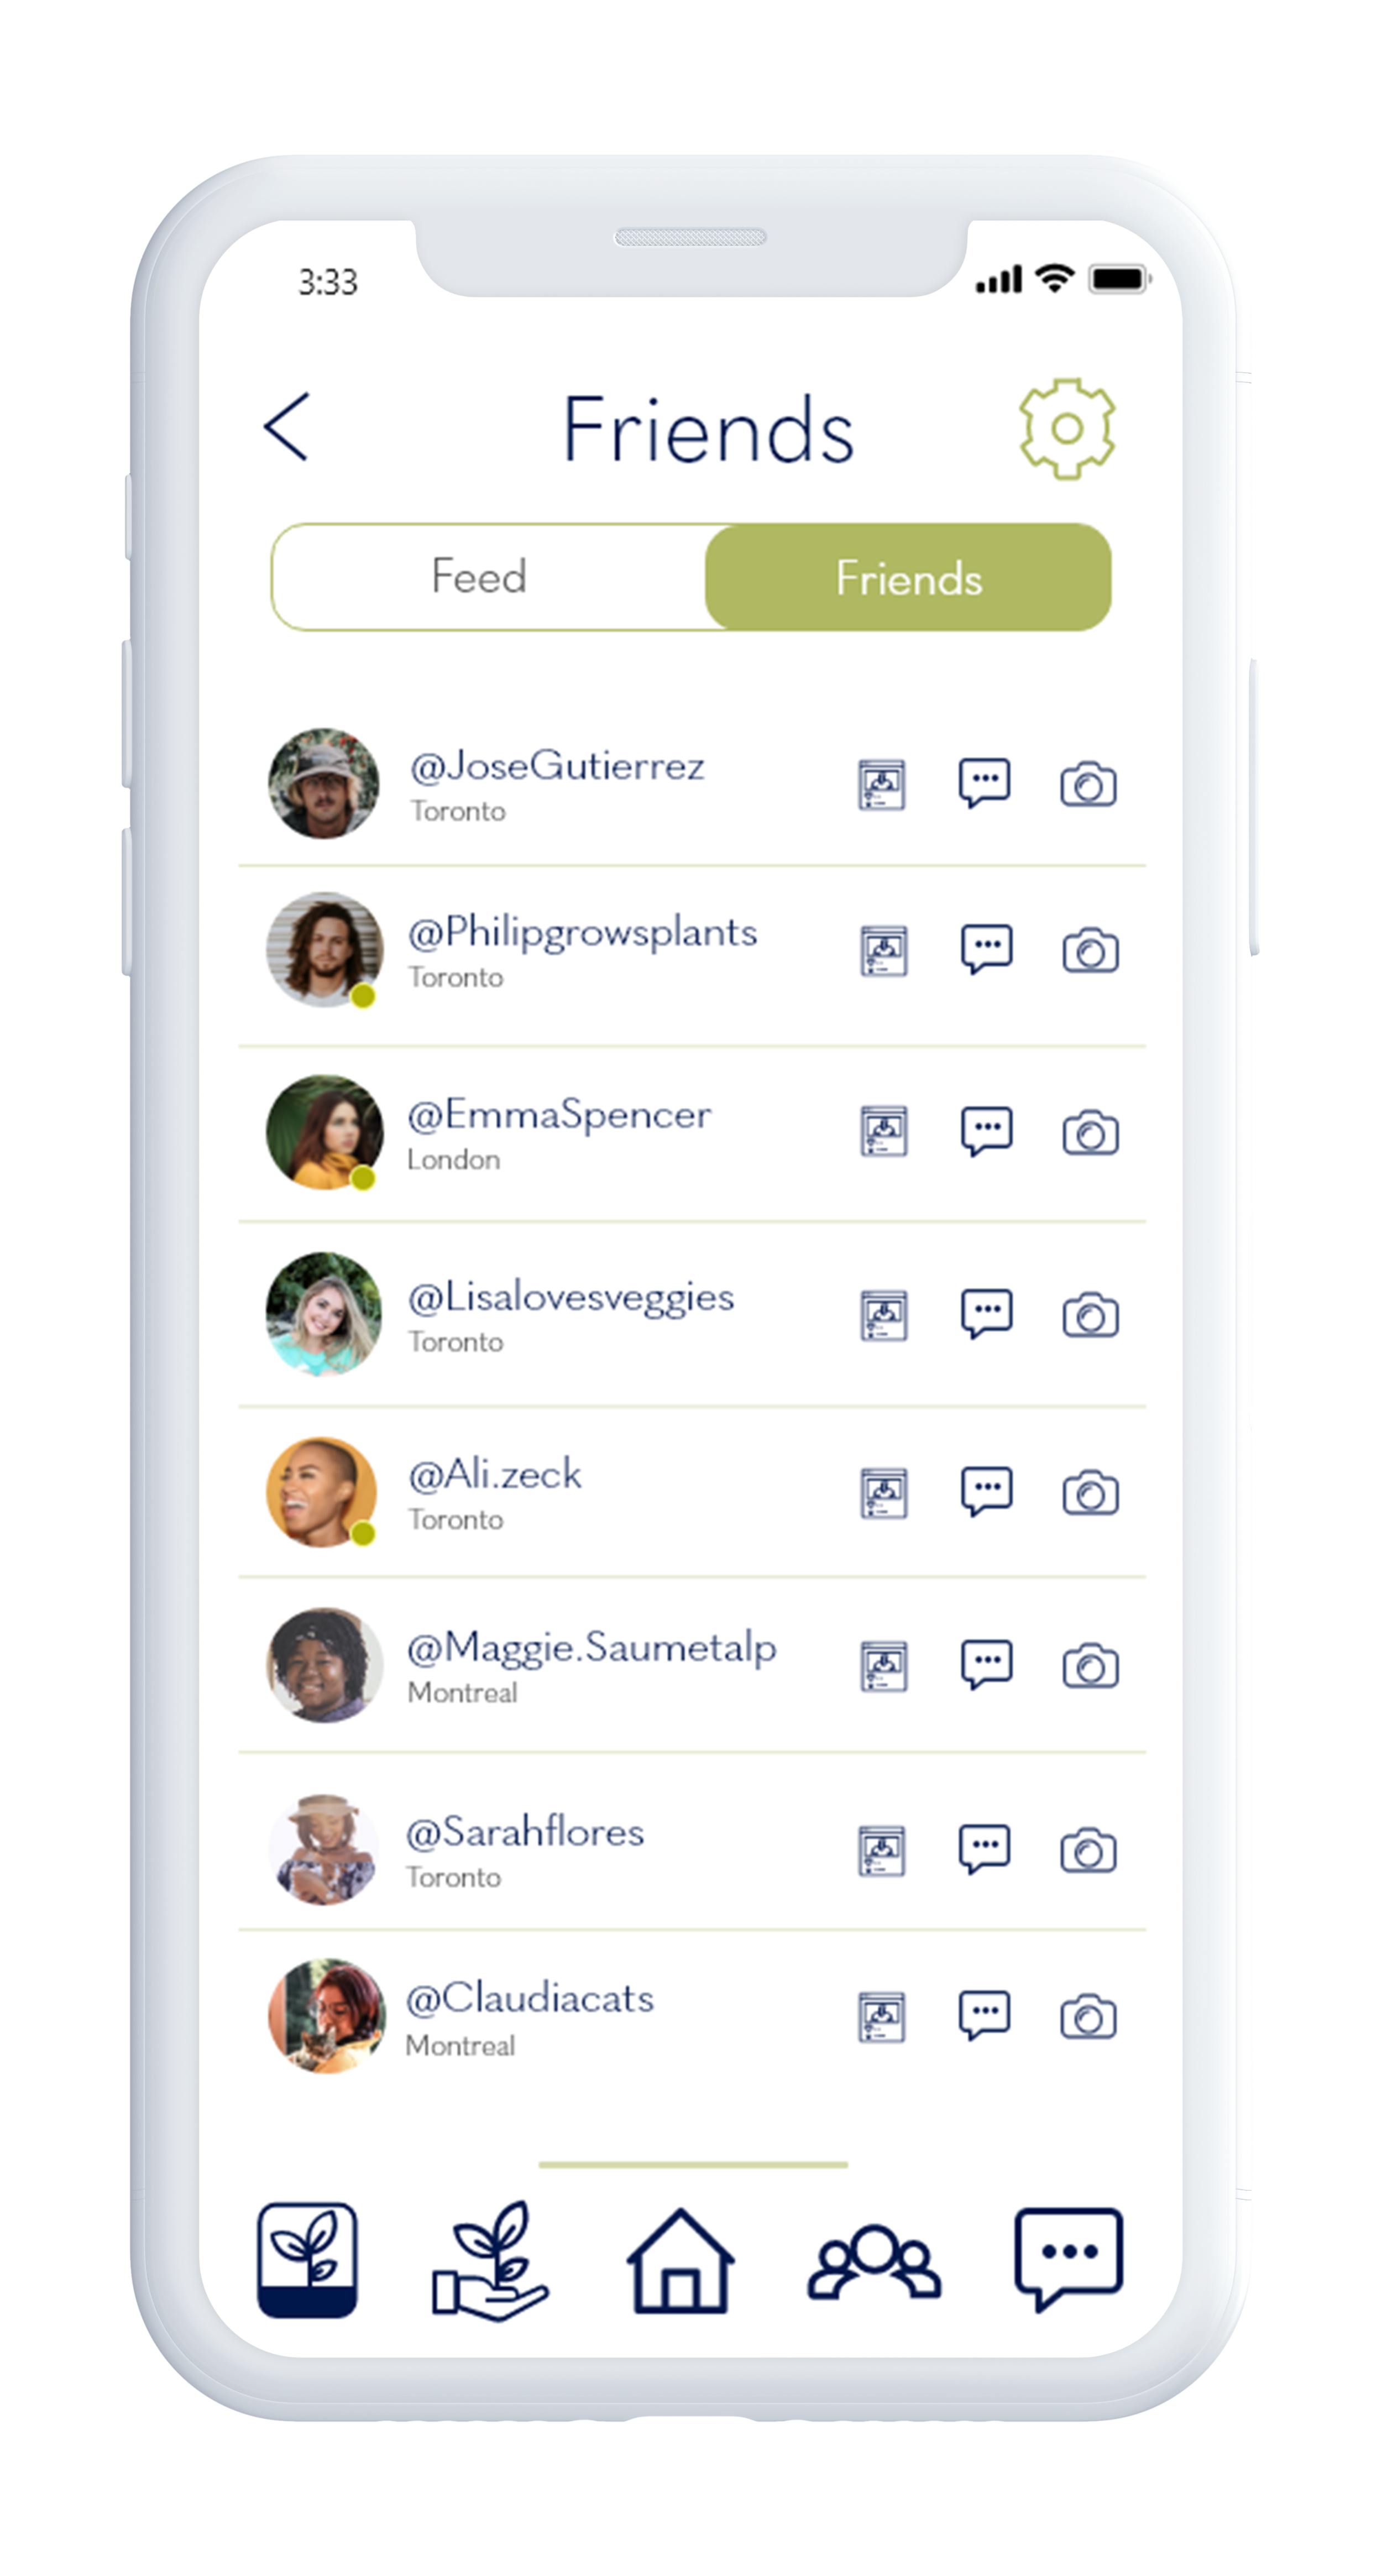
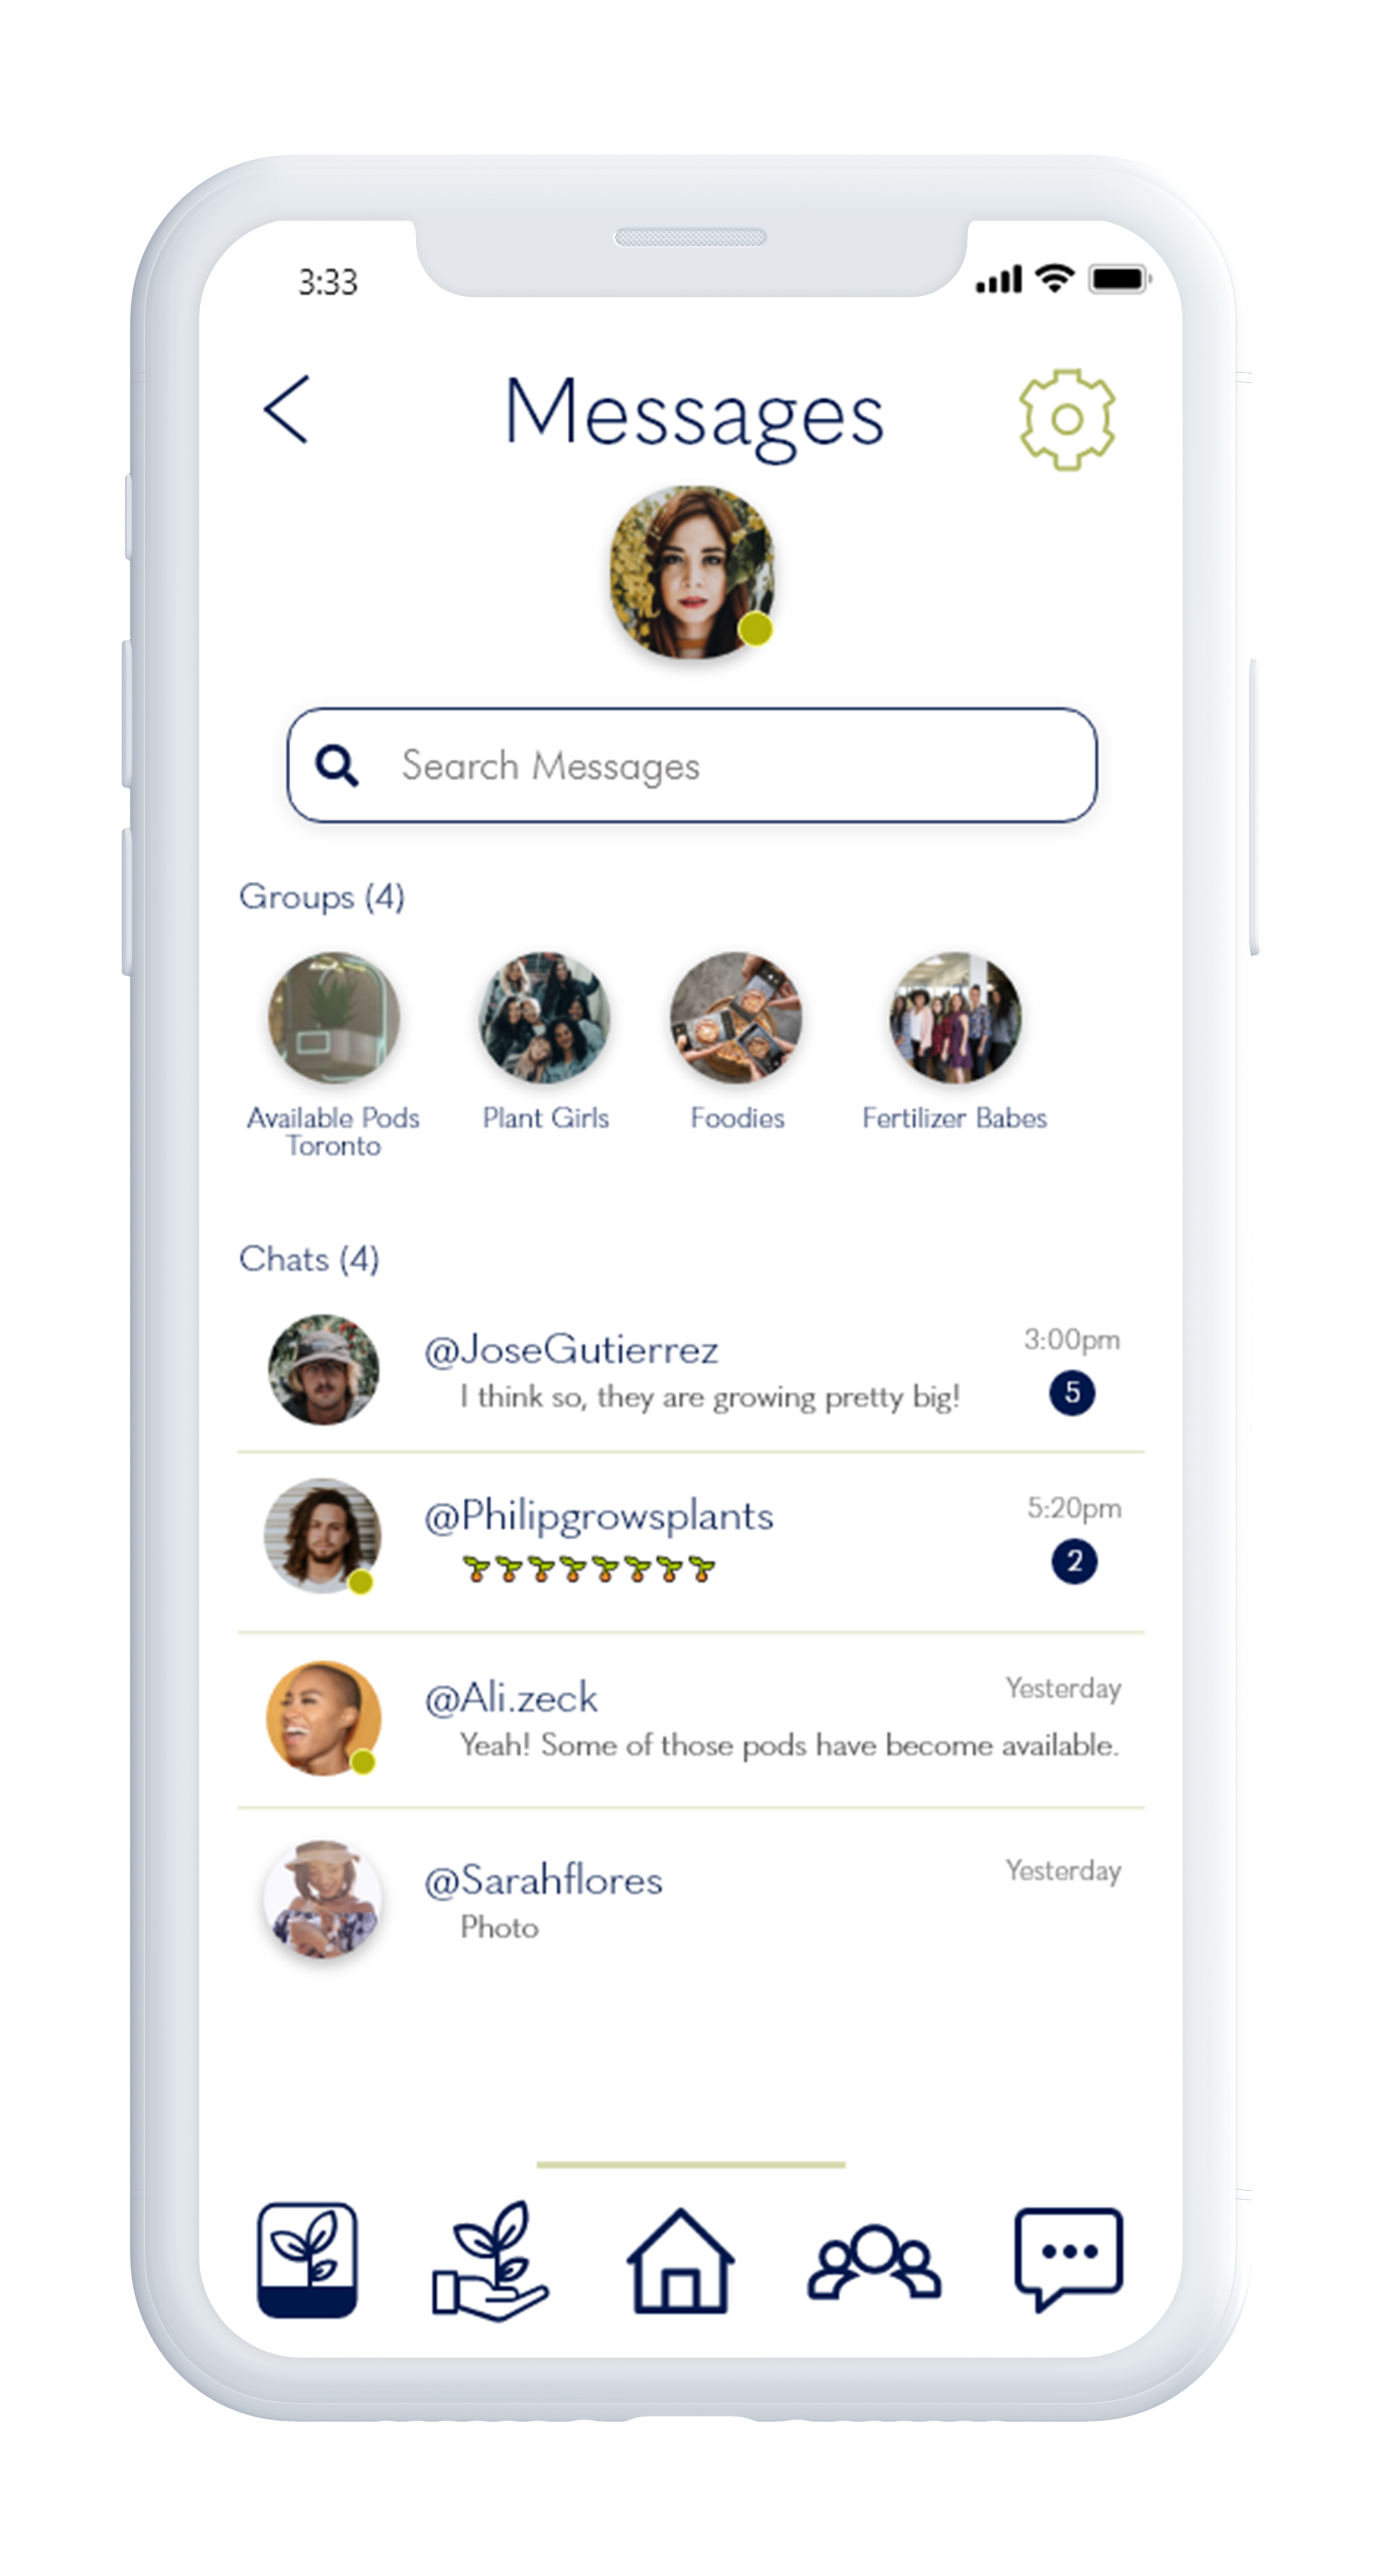
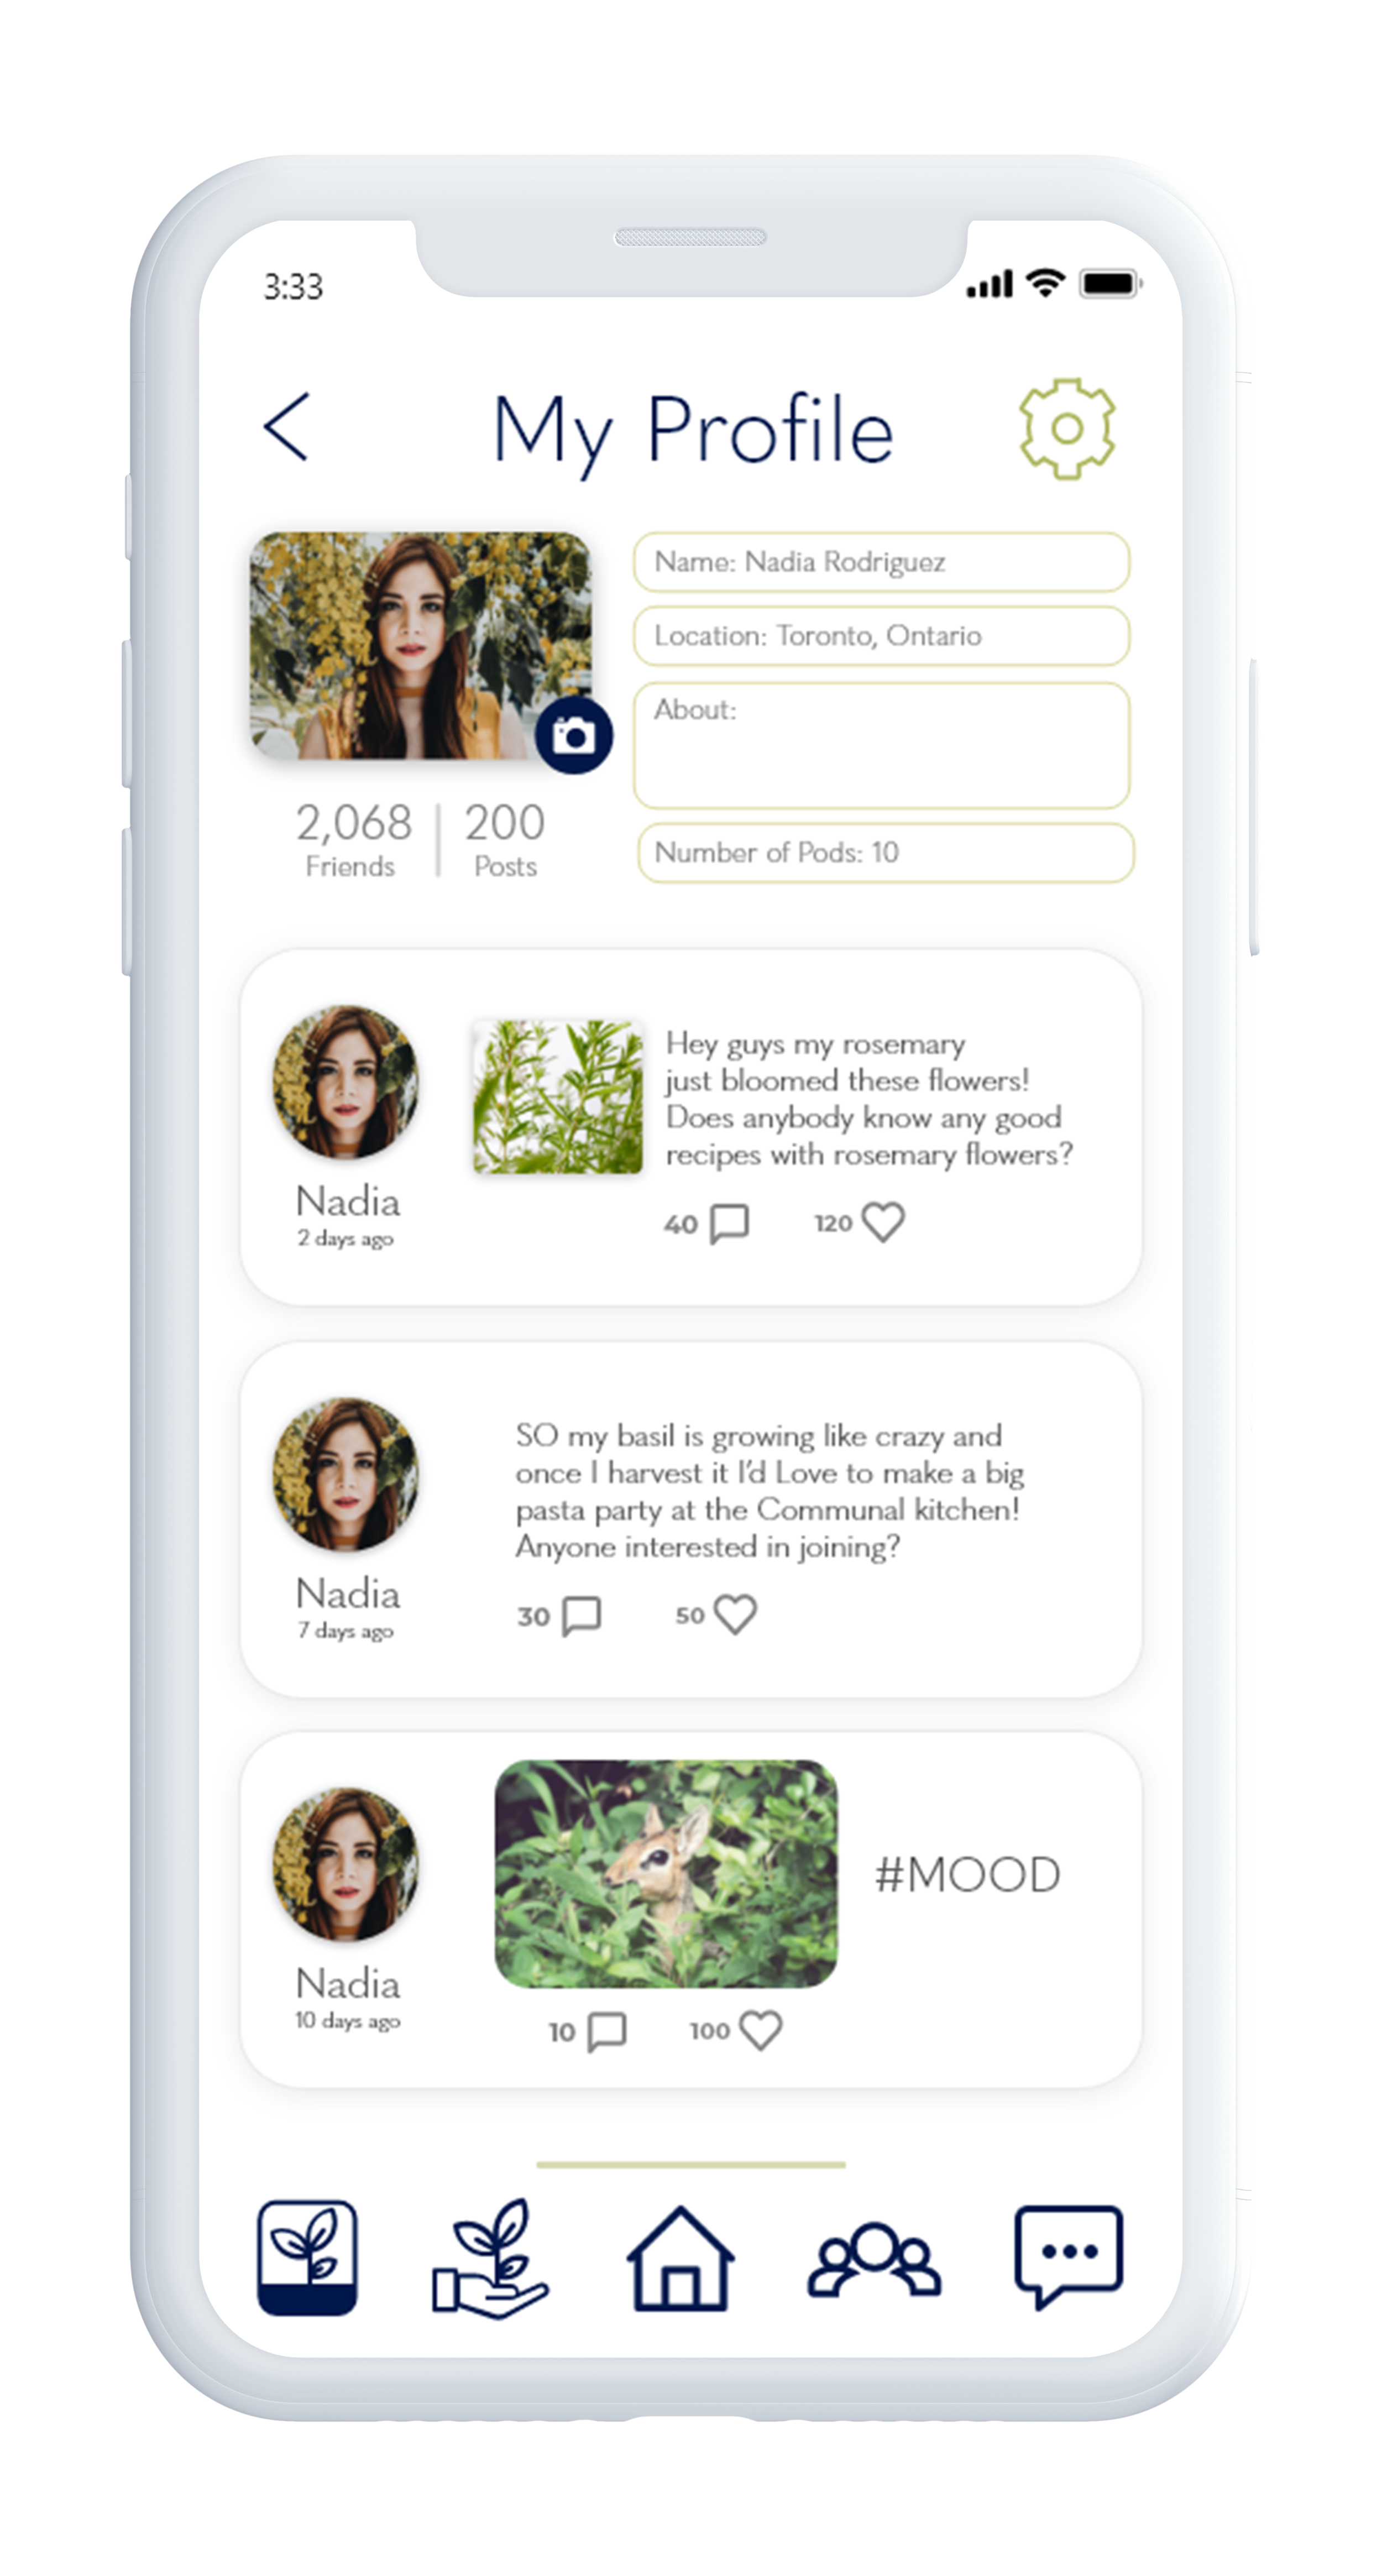

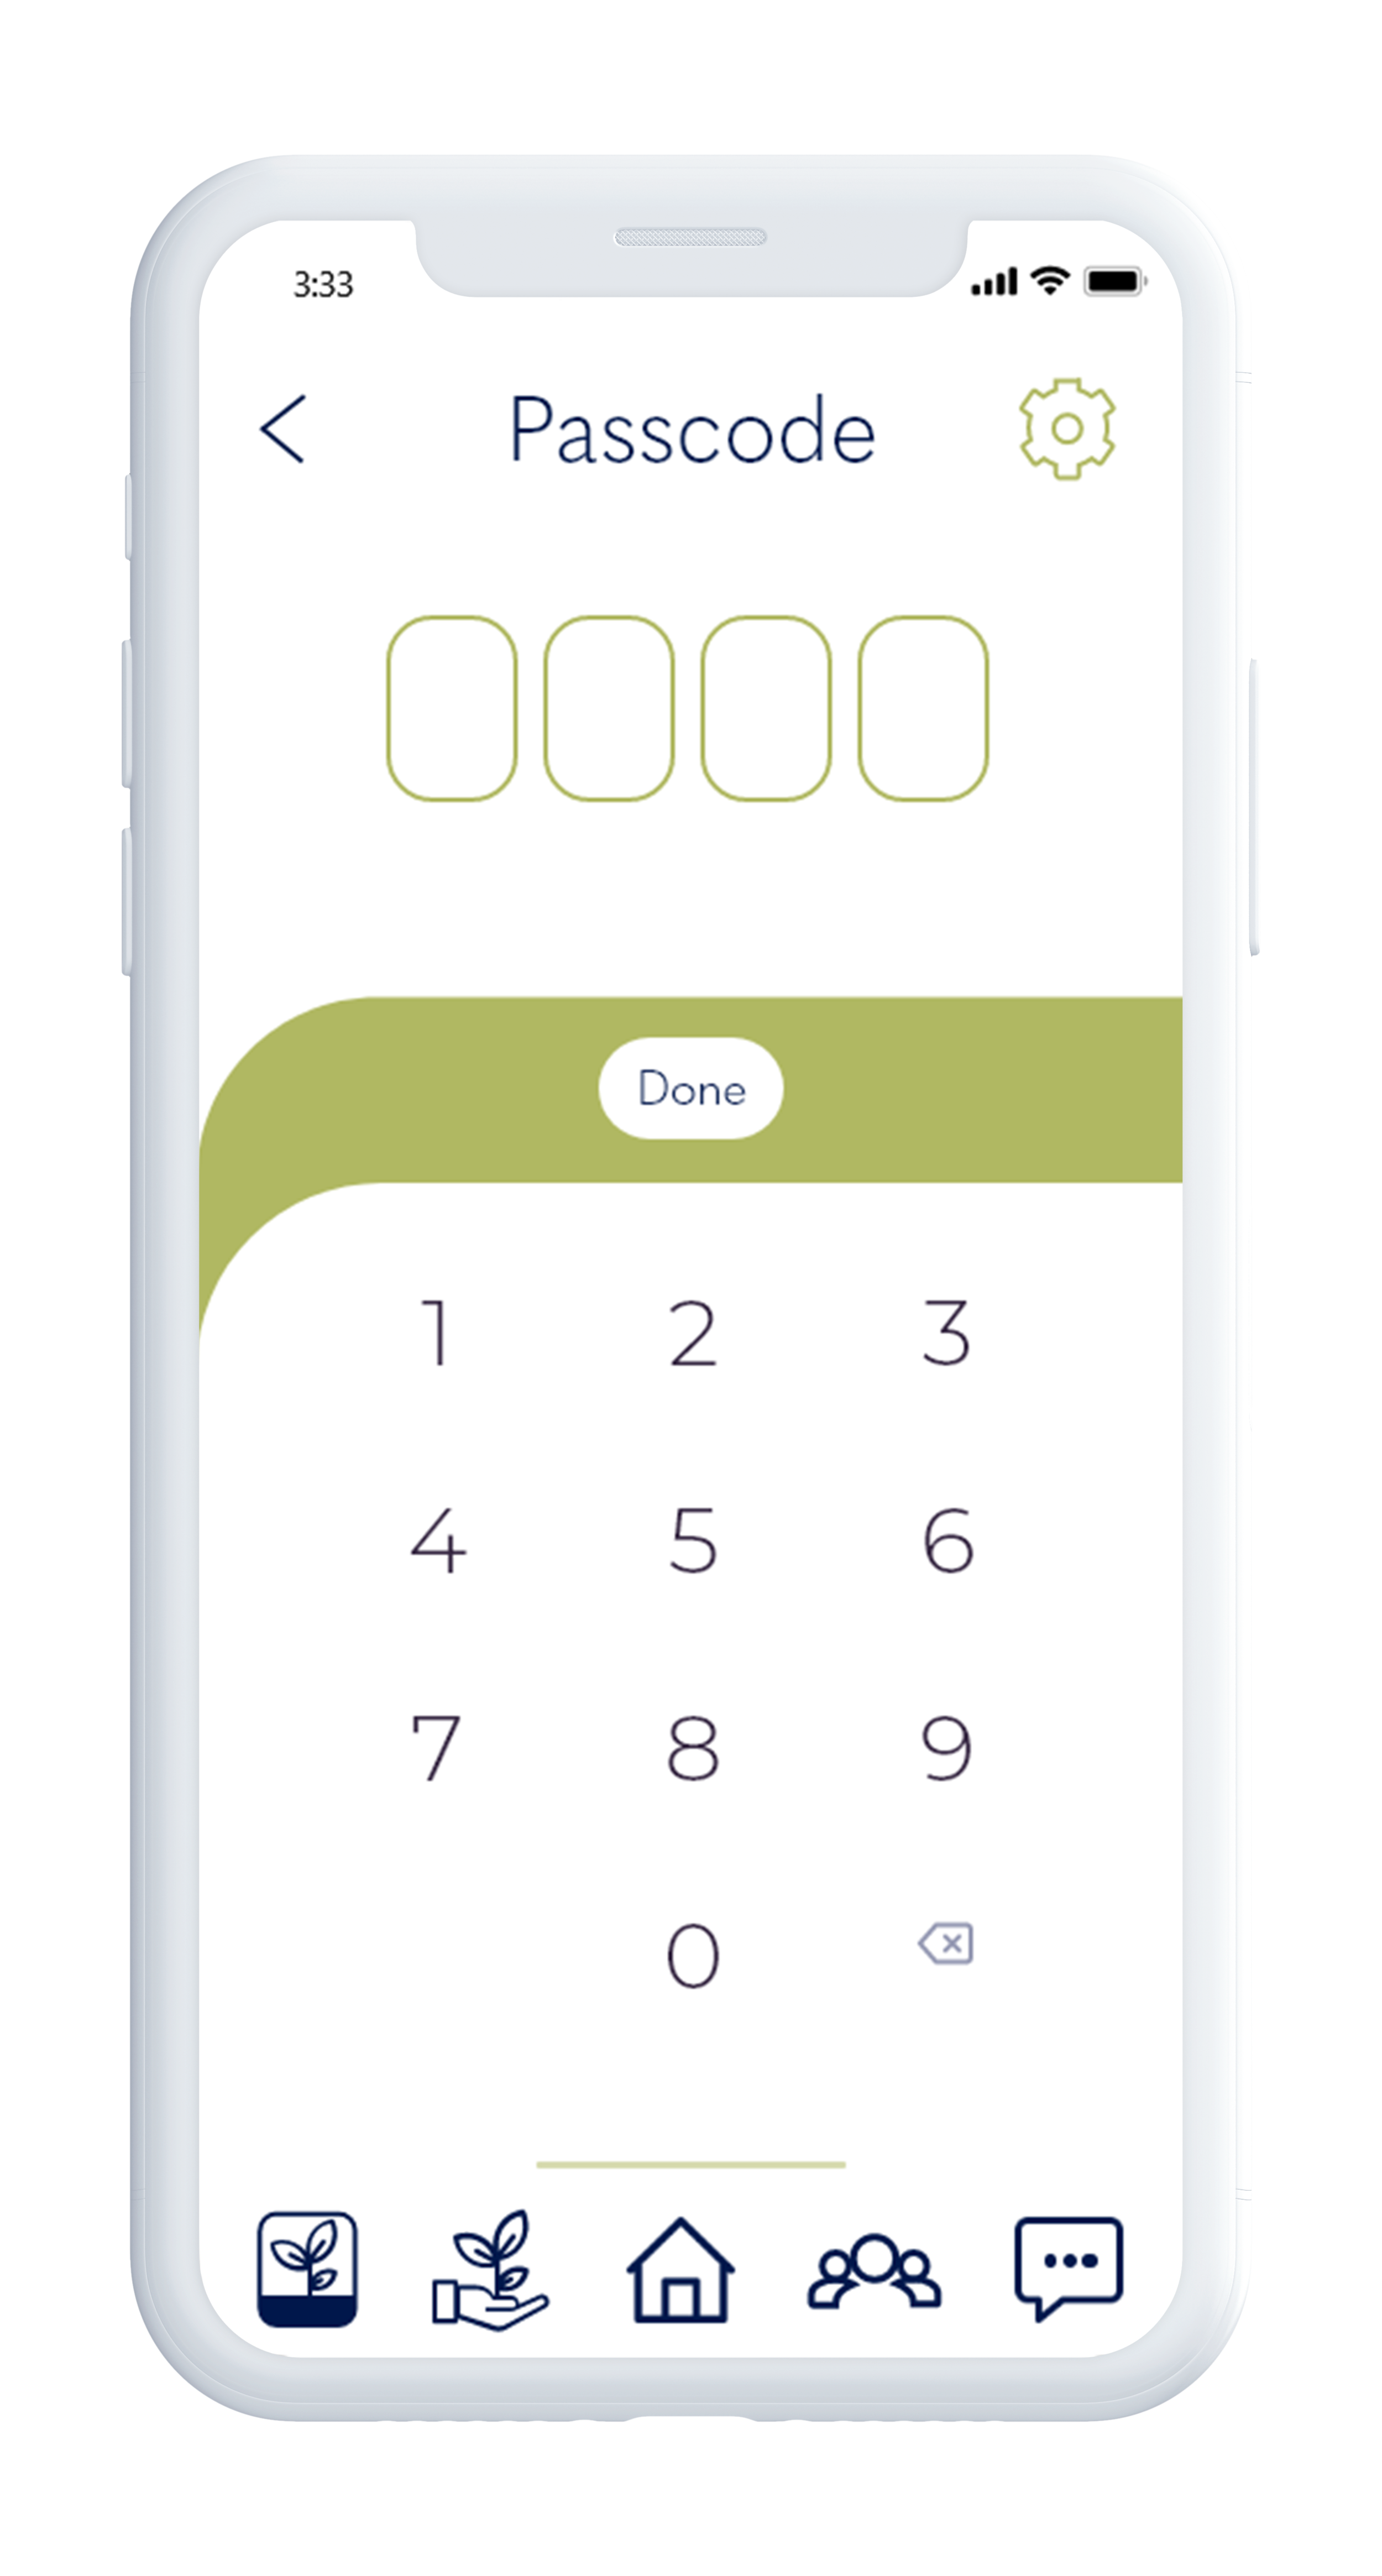
Micro-interactions
This short video shows an example of the micro-interaction animations that would match the app’s style.
These were made using Adobe After Effects.
Prototype
This short video shows an example of how a user could navigate through the screens of the app. The full interactive prototype can be found here.


